INTRODUCTION
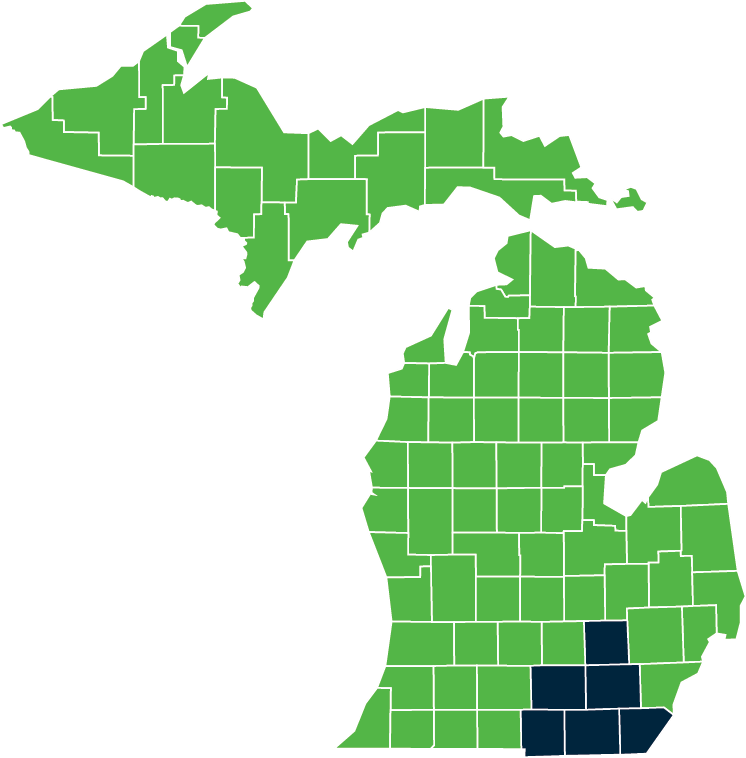
The Greater Ann Arbor Region’s (GAAR) Prosperity Initiative is a collaborative partnership of six counties — Hillsdale, Jackson, Lenawee, Livingston, Monroe, and Washtenaw — that work together to address workforce and economic development issues and to serve businesses seeking a destination for relocation or expansion.
To see videos of what brings and keeps companies in the region, click here.
“With a little effort, we have a hidden talent pool ready to engage in the workforce.”
This online resource was developed by the Prosperity Initiative to:
- Understand the unique conditions in the region and show how transportation can influence workforce outcomes.
- Describe different transportation options including emerging mobility options that could serve as alternatives to the private automobile.
- Explore workforce and transportation challenges amongst transportation disadvantaged communities (TDCs).1
- Provide resources for agencies, community organizations, employers, and others to identify transportation solutions that meet their needs
ABOUT
HOW TO USE THIS GUIDE
Use this guide to determine the shared mobility options that best meet the needs of your application:
- Use the PLANNING section to match the needs of your target audience to transportation solutions.
- Use the INTERACTIVE MAP to identify opportunity areas where different modes might be feasible based on the area’s access to reliable and frequent transit.
- Use the MOBILITY OPTIONS section to find out more about different modes and case studies of where these have been applied.
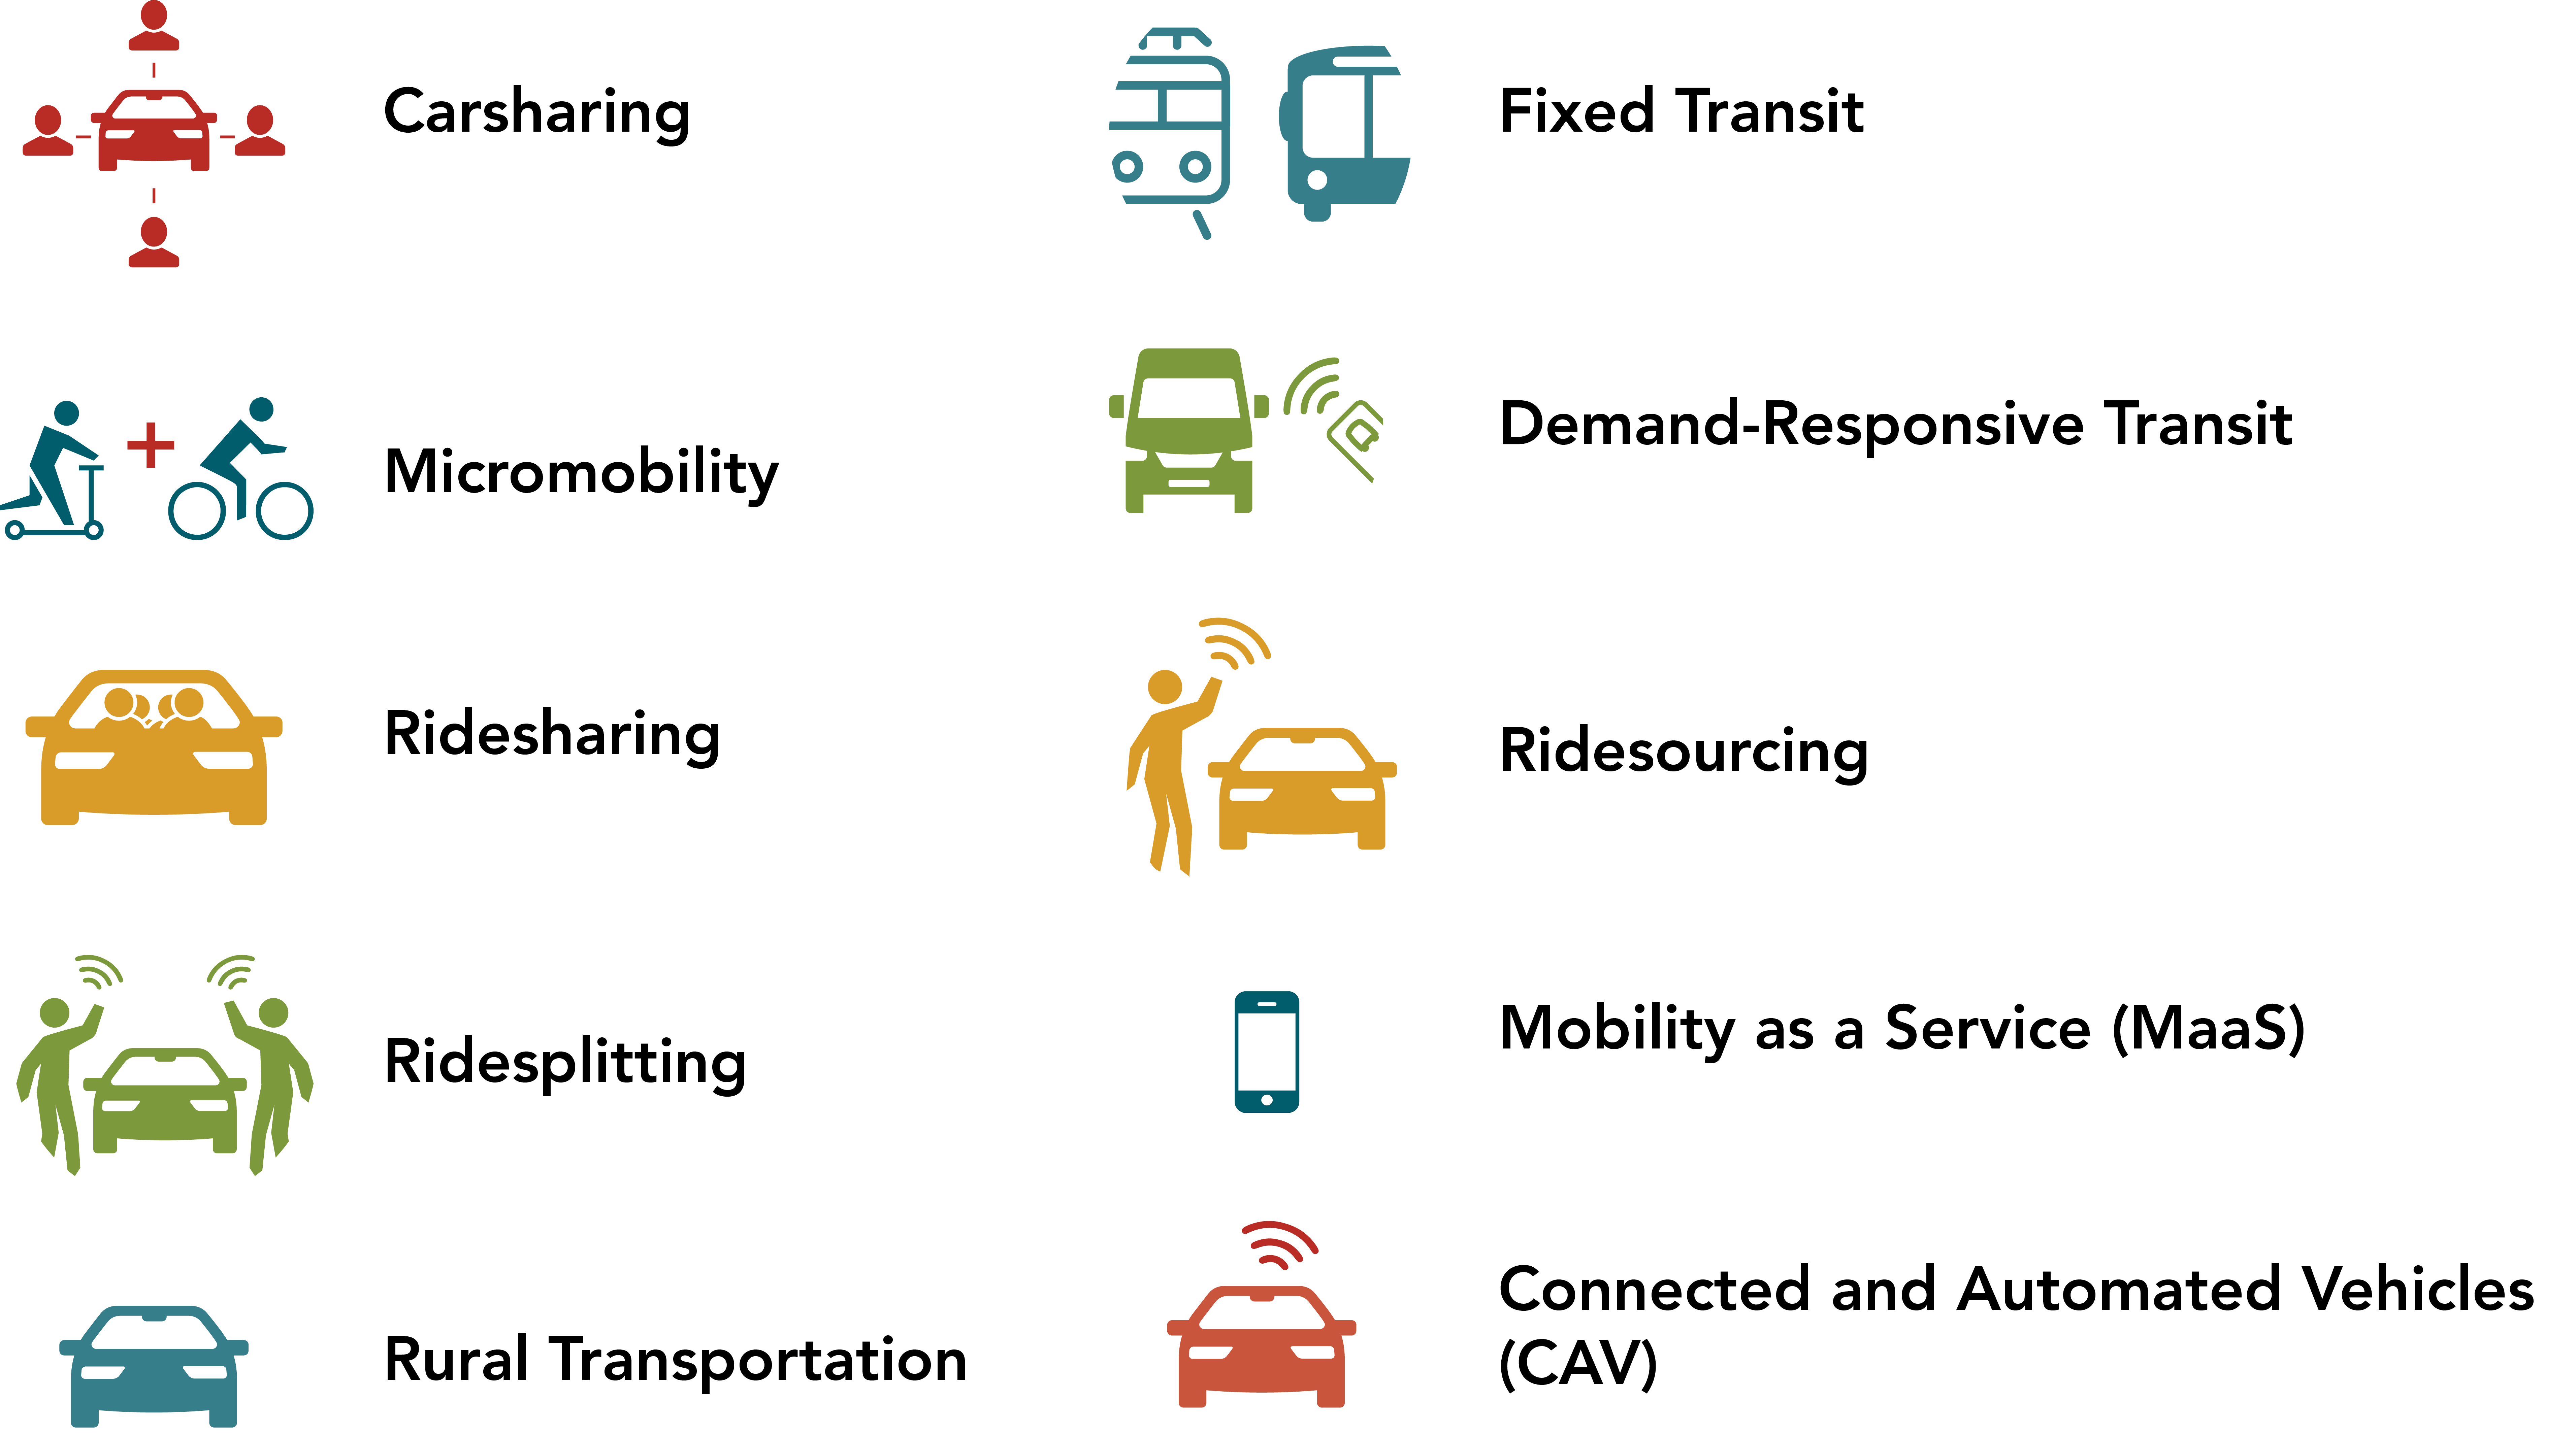
There are 7 shared mobility categories and 3 special topic areas considered in this guide. These icons will help you find the relevant topic areas:
PLANNING
It is recognized that there is a workforce shortage at all job skill levels in the Greater Ann Arbor Region. Affordable and reliable transportation plays a role in this – particularly in connecting individuals to low- and middle-skilled jobs.
Use this section to:
- Learn about the barriers preventing increased workforce participation
- Understand the characteristics and needs of different shared mobility options
- See what services there are currently in the region
- Identify the areas with the greatest opportunities for shared mobility
- Learn about the challenges that need to be addressed so as not to further marginalize transportation disadvantaged communities.
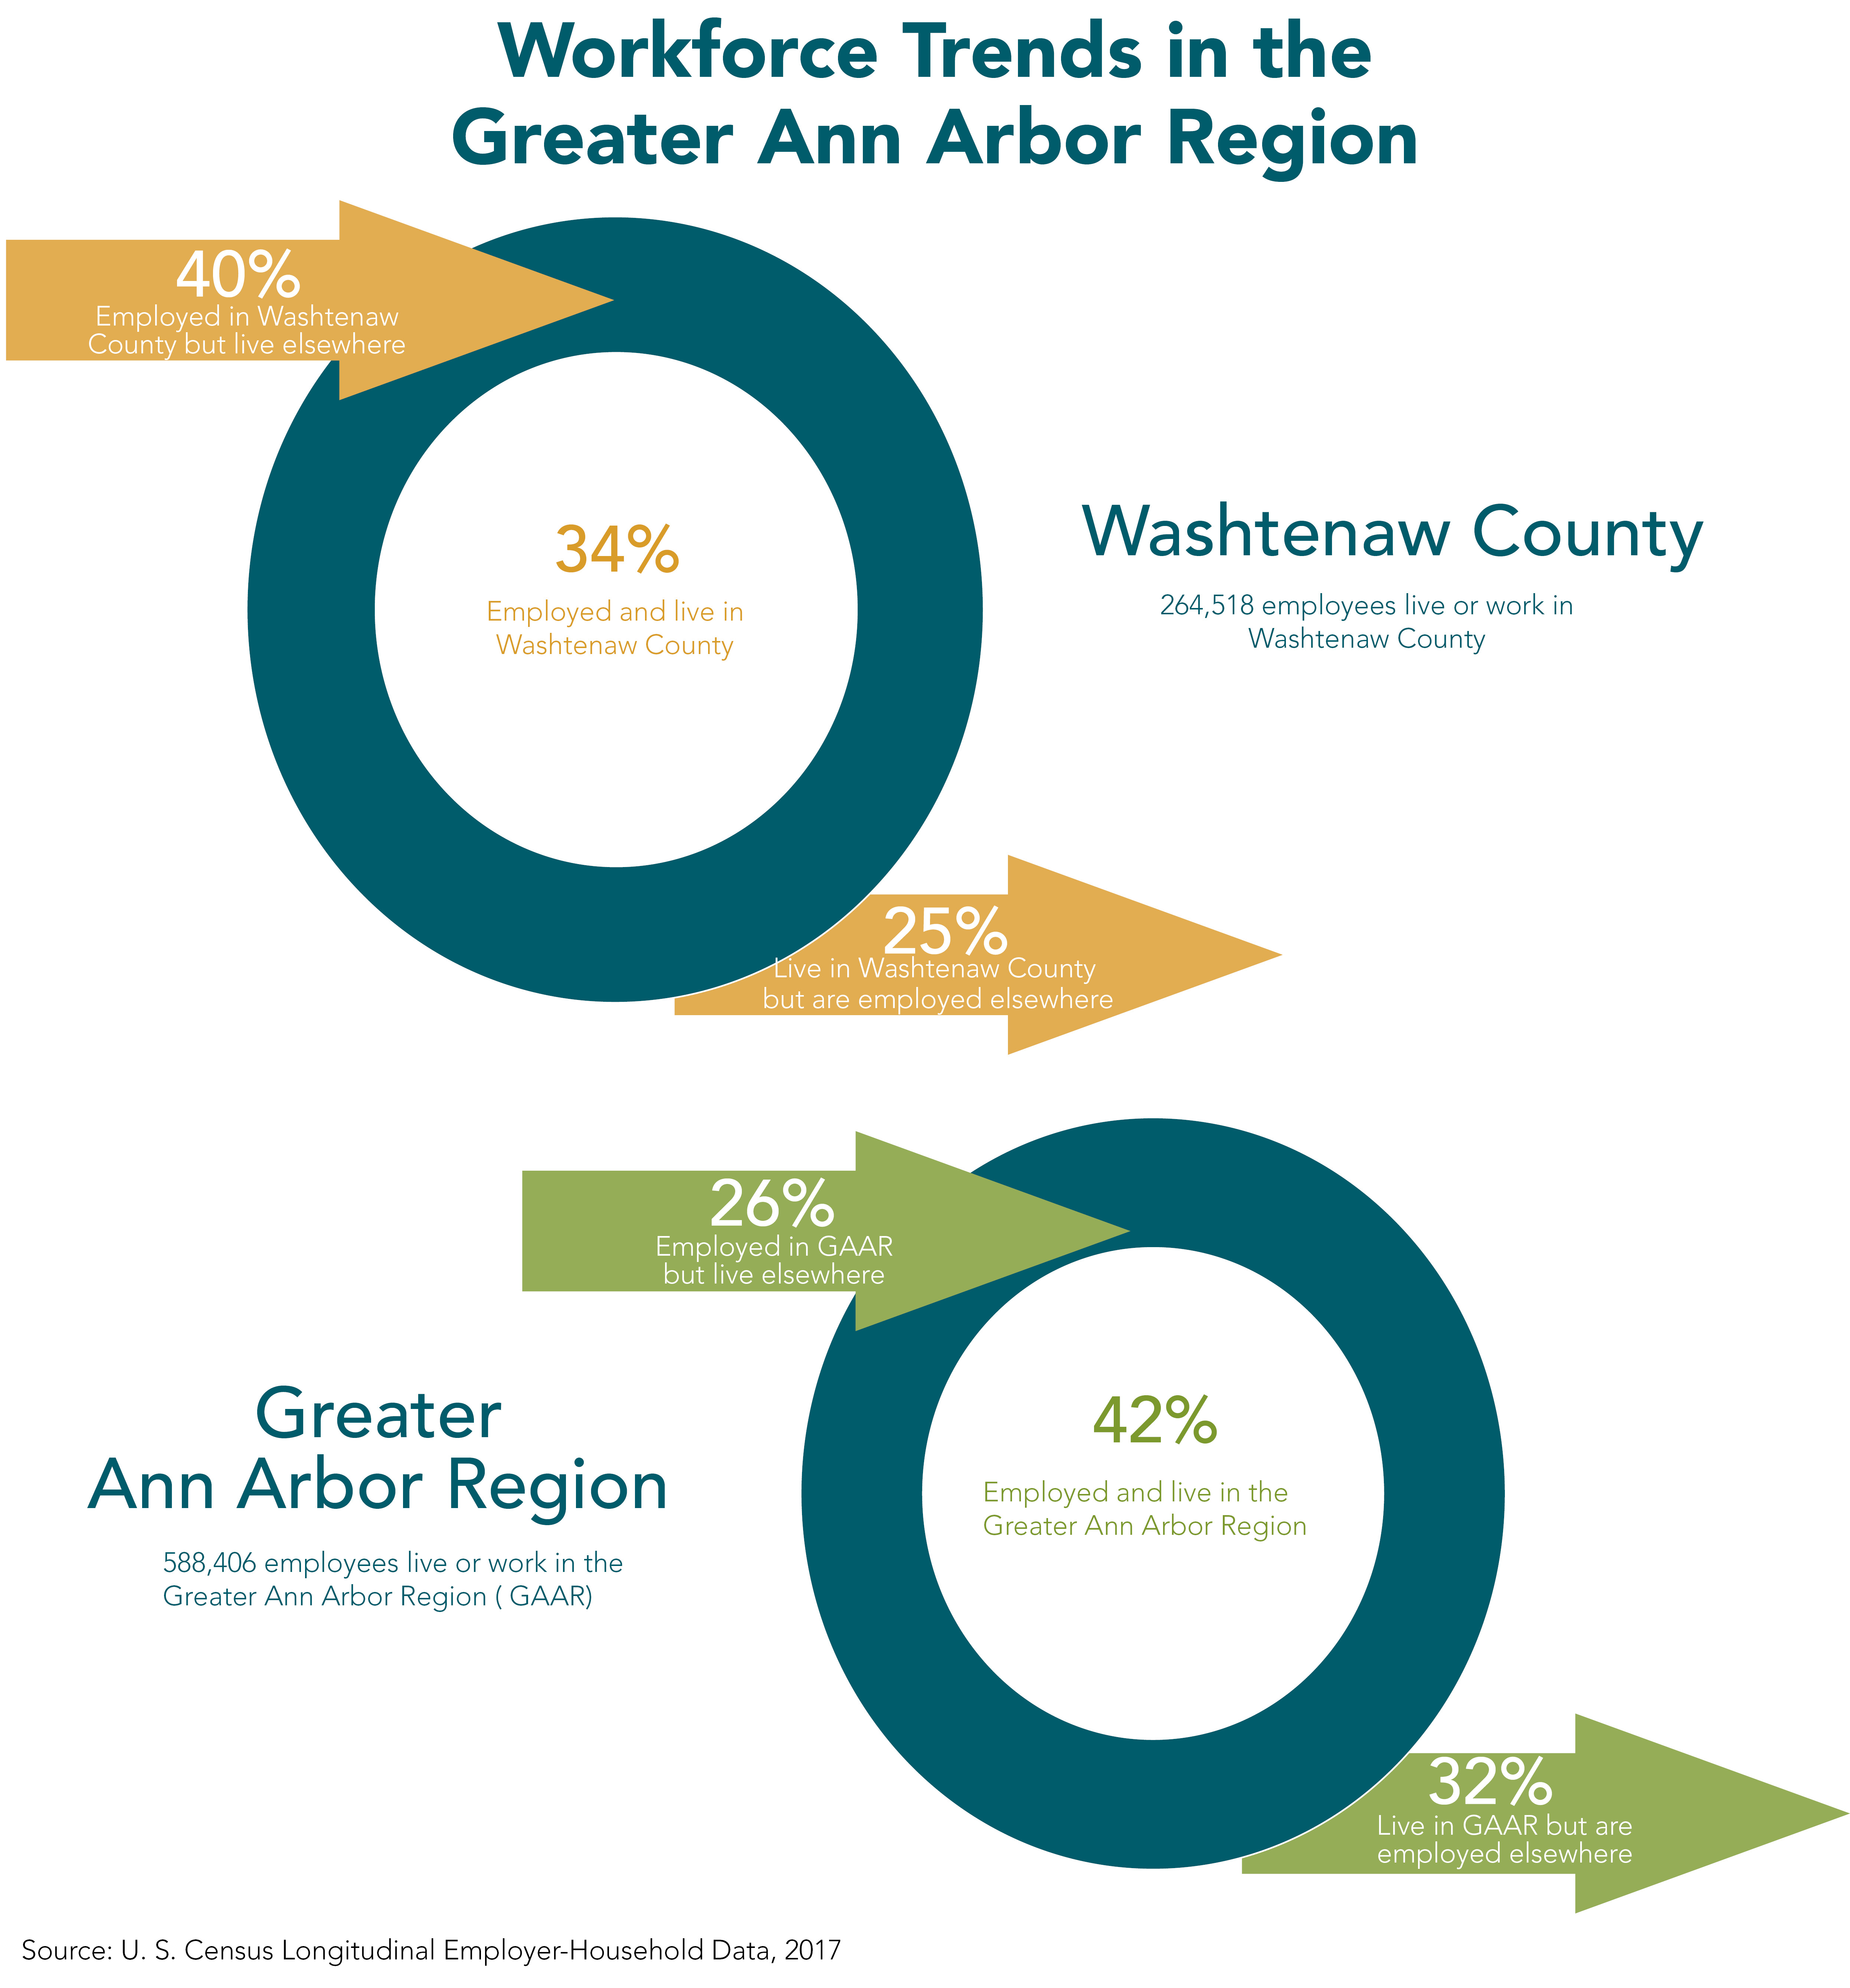
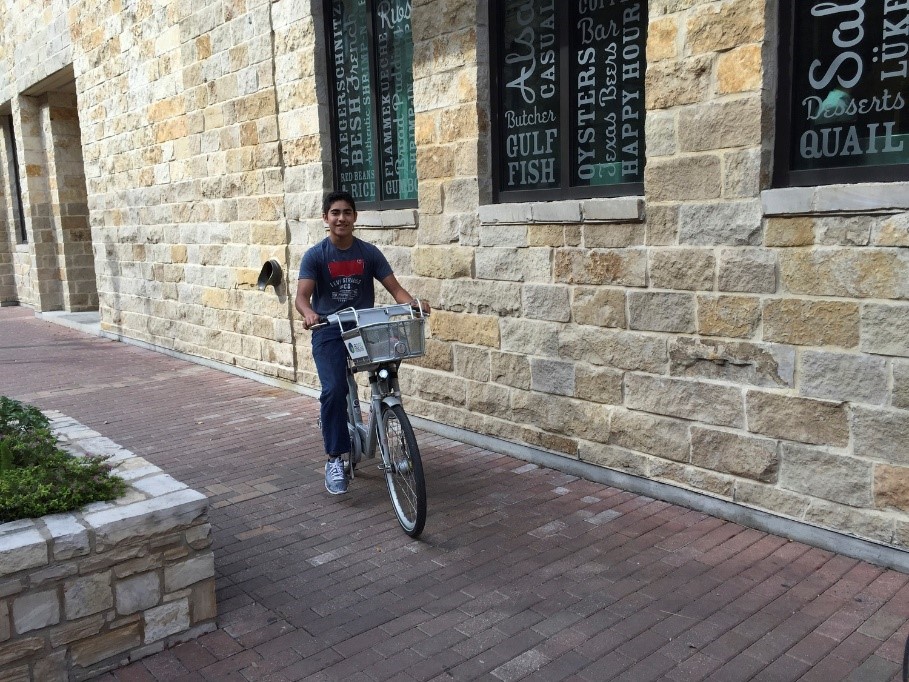
The graphics below and to the right show the transportation trends of the workforce in the region.

PLANNING
IMPACTING WORKFORCE OUTCOMES THROUGH TRANSPORTATION
The Citizens Research Council recently explored Opportunities for Michigan to Grow and Leverage its Labor Force and found that the majority of job openings in Michigan are concentrated in low- and middle-skilled jobs. It also found that discouraged workers, those marginally attached to the workforce, those working part-time, and those that have dropped out of the workforce are likely candidates to fill many of these job openings, but are confronted with several barriers. At the highest level, most state workforce development programs focus on the unemployed and those in poverty, as dictated by federal requirements. This leaves a gap with minimal attention given to the “hidden talent pool” that is best placed to contribute to the economy.
Asset Limited, Income Constrained, Employed (ALICE) households fit into this category. These are individuals and households that have incomes above the federal poverty level, but that struggle to afford basic household necessities. The ALICE in Michigan study found that:
- 43% of households in Michigan had incomes below the ALICE threshold (i.e., 14% below the poverty line and 29% between the poverty and ALICE income thresholds)
- In 2017, individuals required a full-time wage of $10.52/hr and a household with 2 adults, 1 infant, and 1 preschooler required a full-time wage of $30.64/hr to cover basic costs
- 61% of jobs in Michigan in 2017 earned less than $20 per hour and another 29% earned between $20-$40 per hour.
- Barriers to employment for ALICE populations include:
- Lack of job skills
- Family care responsibilities
- Physical and mental health problems
- Limited English proficiency
- Lack of reliable transportation

Some of the transportation issues identified by stakeholders that work with low- and middle-skilled workforces included:
- The coverage of transit is not convenient or the hours of service don’t always cover that start and/or end of a shift
- Focusing on simple solutions to better access transit, e.g., sidewalks, lighting, crossings, etc.
- The biggest interest areas are in increased public transit service and vanpool services
Things employers can do:
- Educate employees on available transportation options
- Subsidize transportation or provide payroll-deductible transportation passes
- Increase flexibility and accommodation of employees with fixed or limited transportation options
CHARACTERISTICS OF SHARED MOBILITY
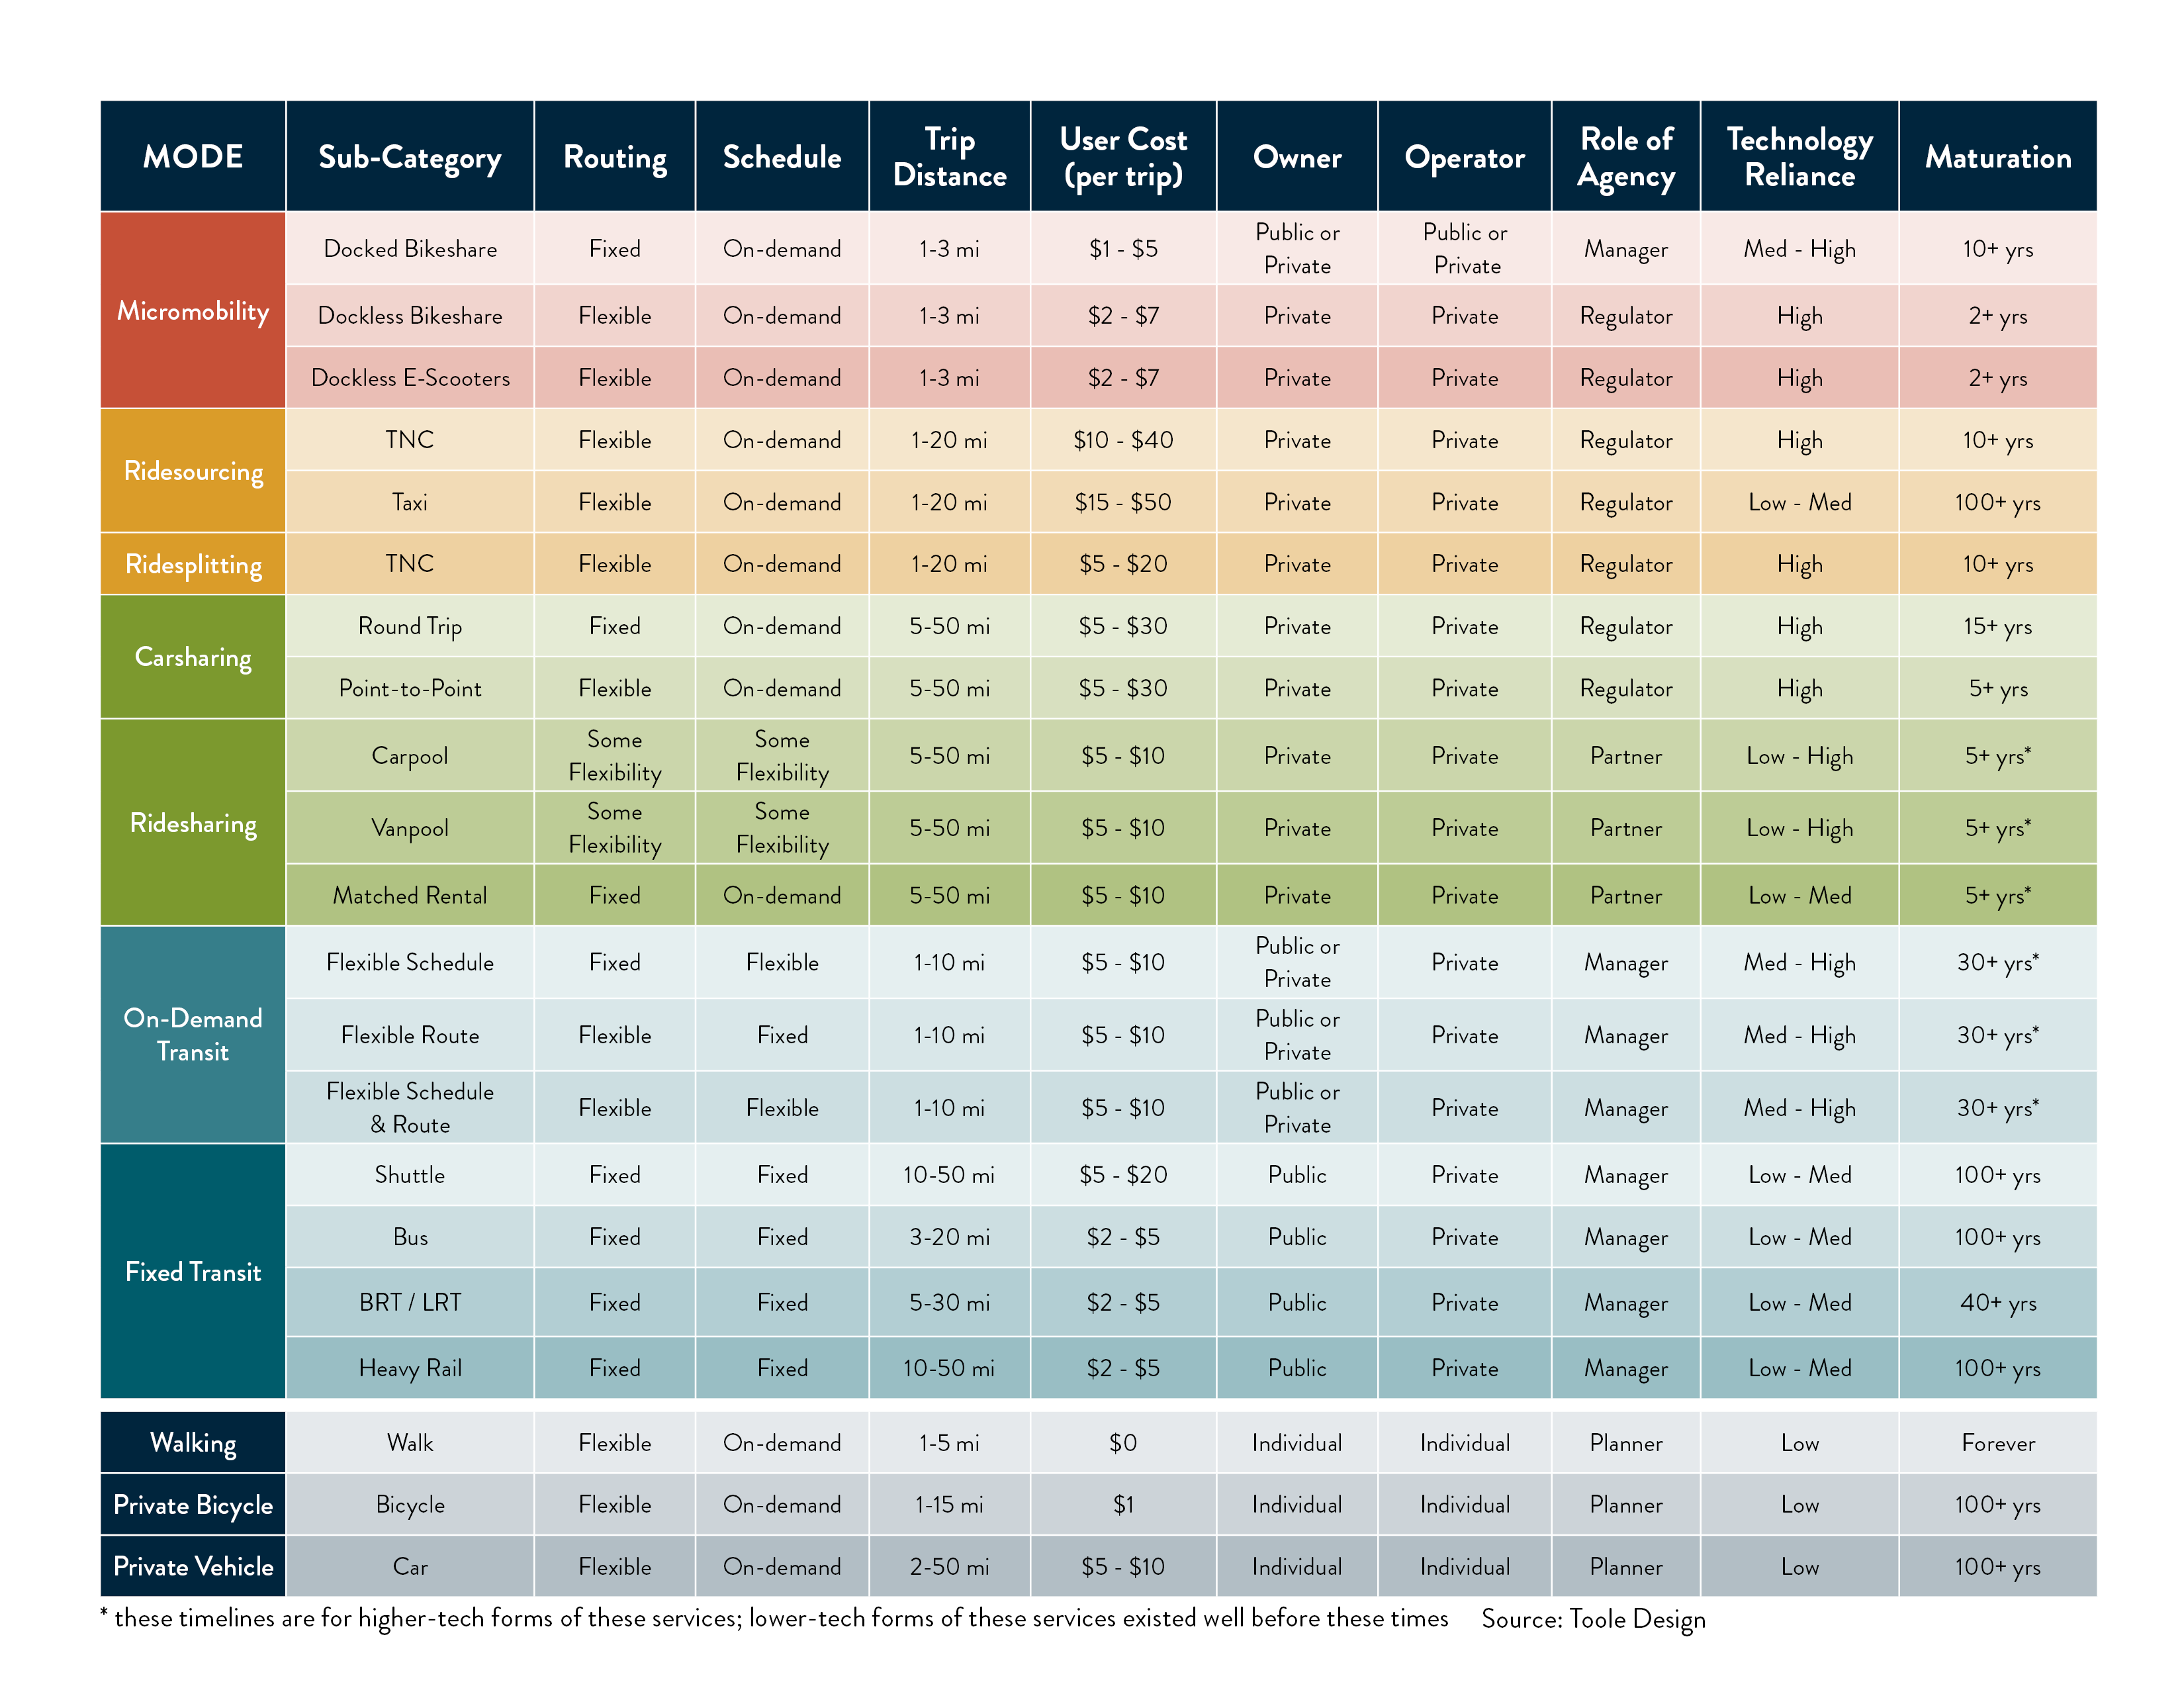
The transportation landscape in the United States has changed dramatically over the last decade. There are now hundreds of shared mobility programs, each with its own unique operating characteristics. However, these mobility offerings can be categorized based on who they serve, the types of trips they are used for, the cost to the user, and their operational characteristics.
For a more detailed summary of each mobility option, click here.
SHARED MOBILITY TREE
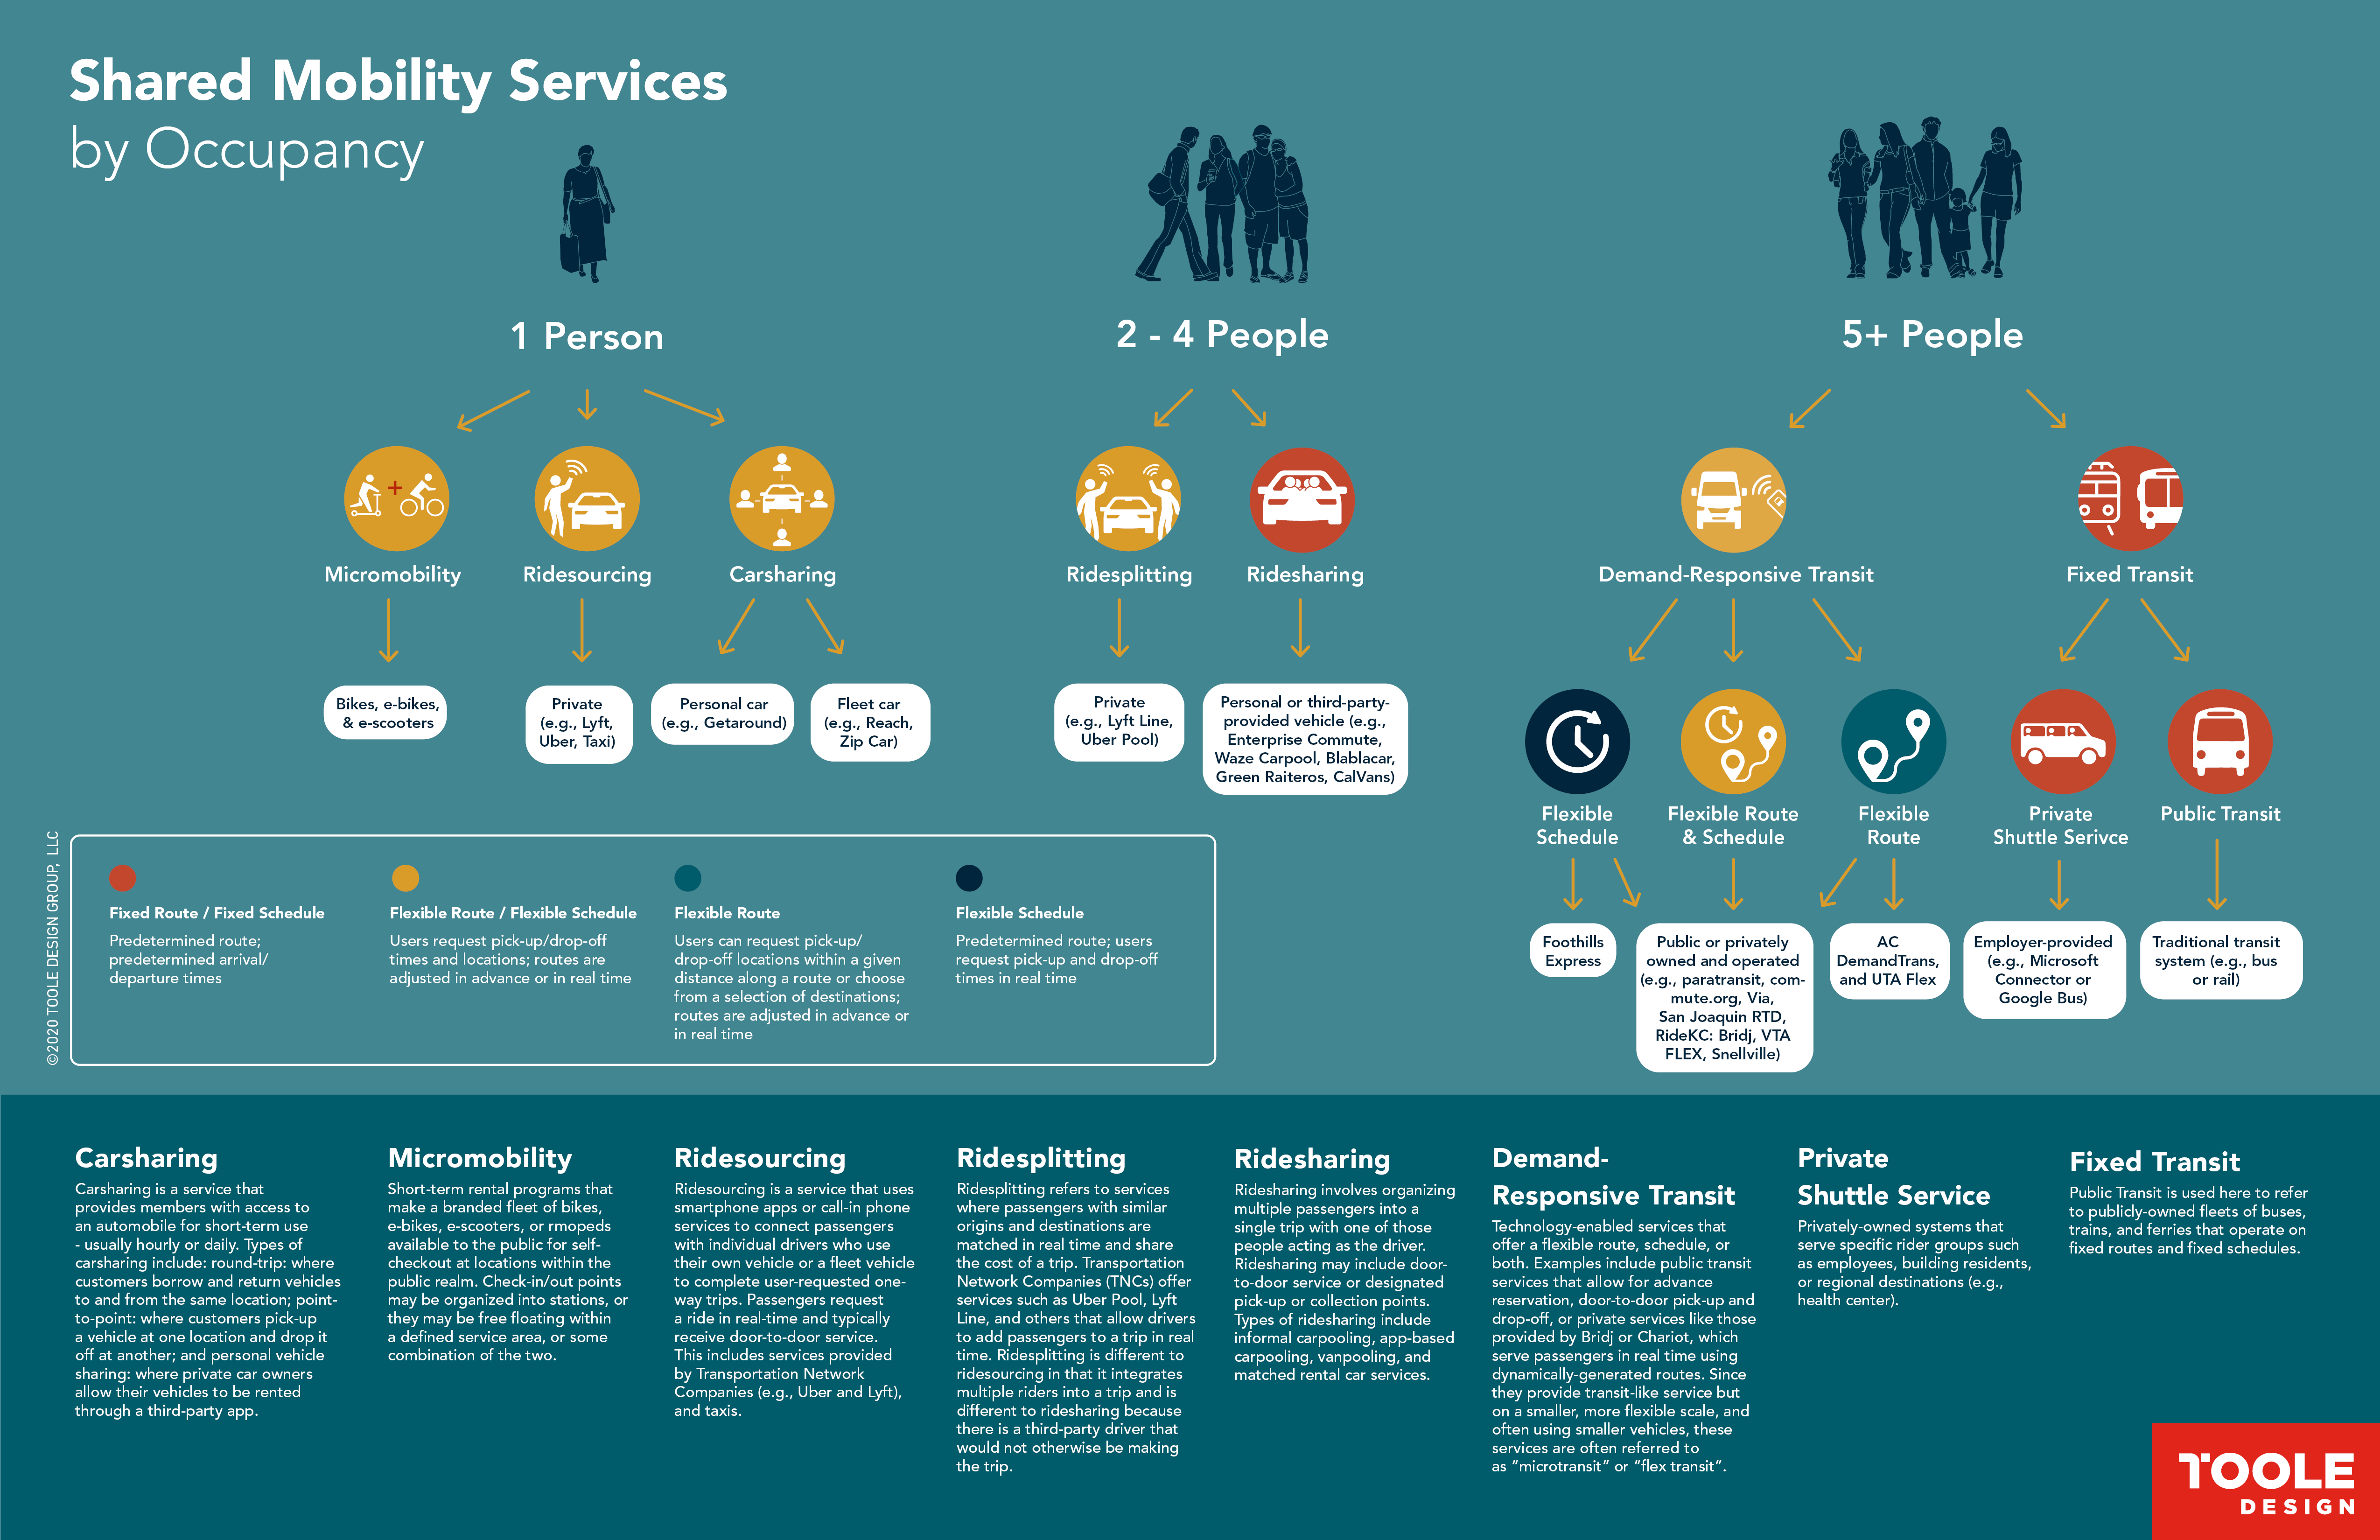
One way to categorize shared mobility is to consider the passenger capacity of each mode. The shared mobility tree shows the typical occupancy of different mobility options and defines whether they operate on fixed or flexible routes or schedules. For example, ridesplitting typically transports two or more people and operates on a flexible route and flexible schedule.
TRANSPORTATION SPECTRUM
The transportation spectrum shows the typical trip distance and cost relationship for each mode. It shows the role that each mode plays in providing a complete mobility solution. The more complete the spectrum, the more competitive the system can be to reducing the region’s reliance on personal automobiles.
MOBILITY MATRIX
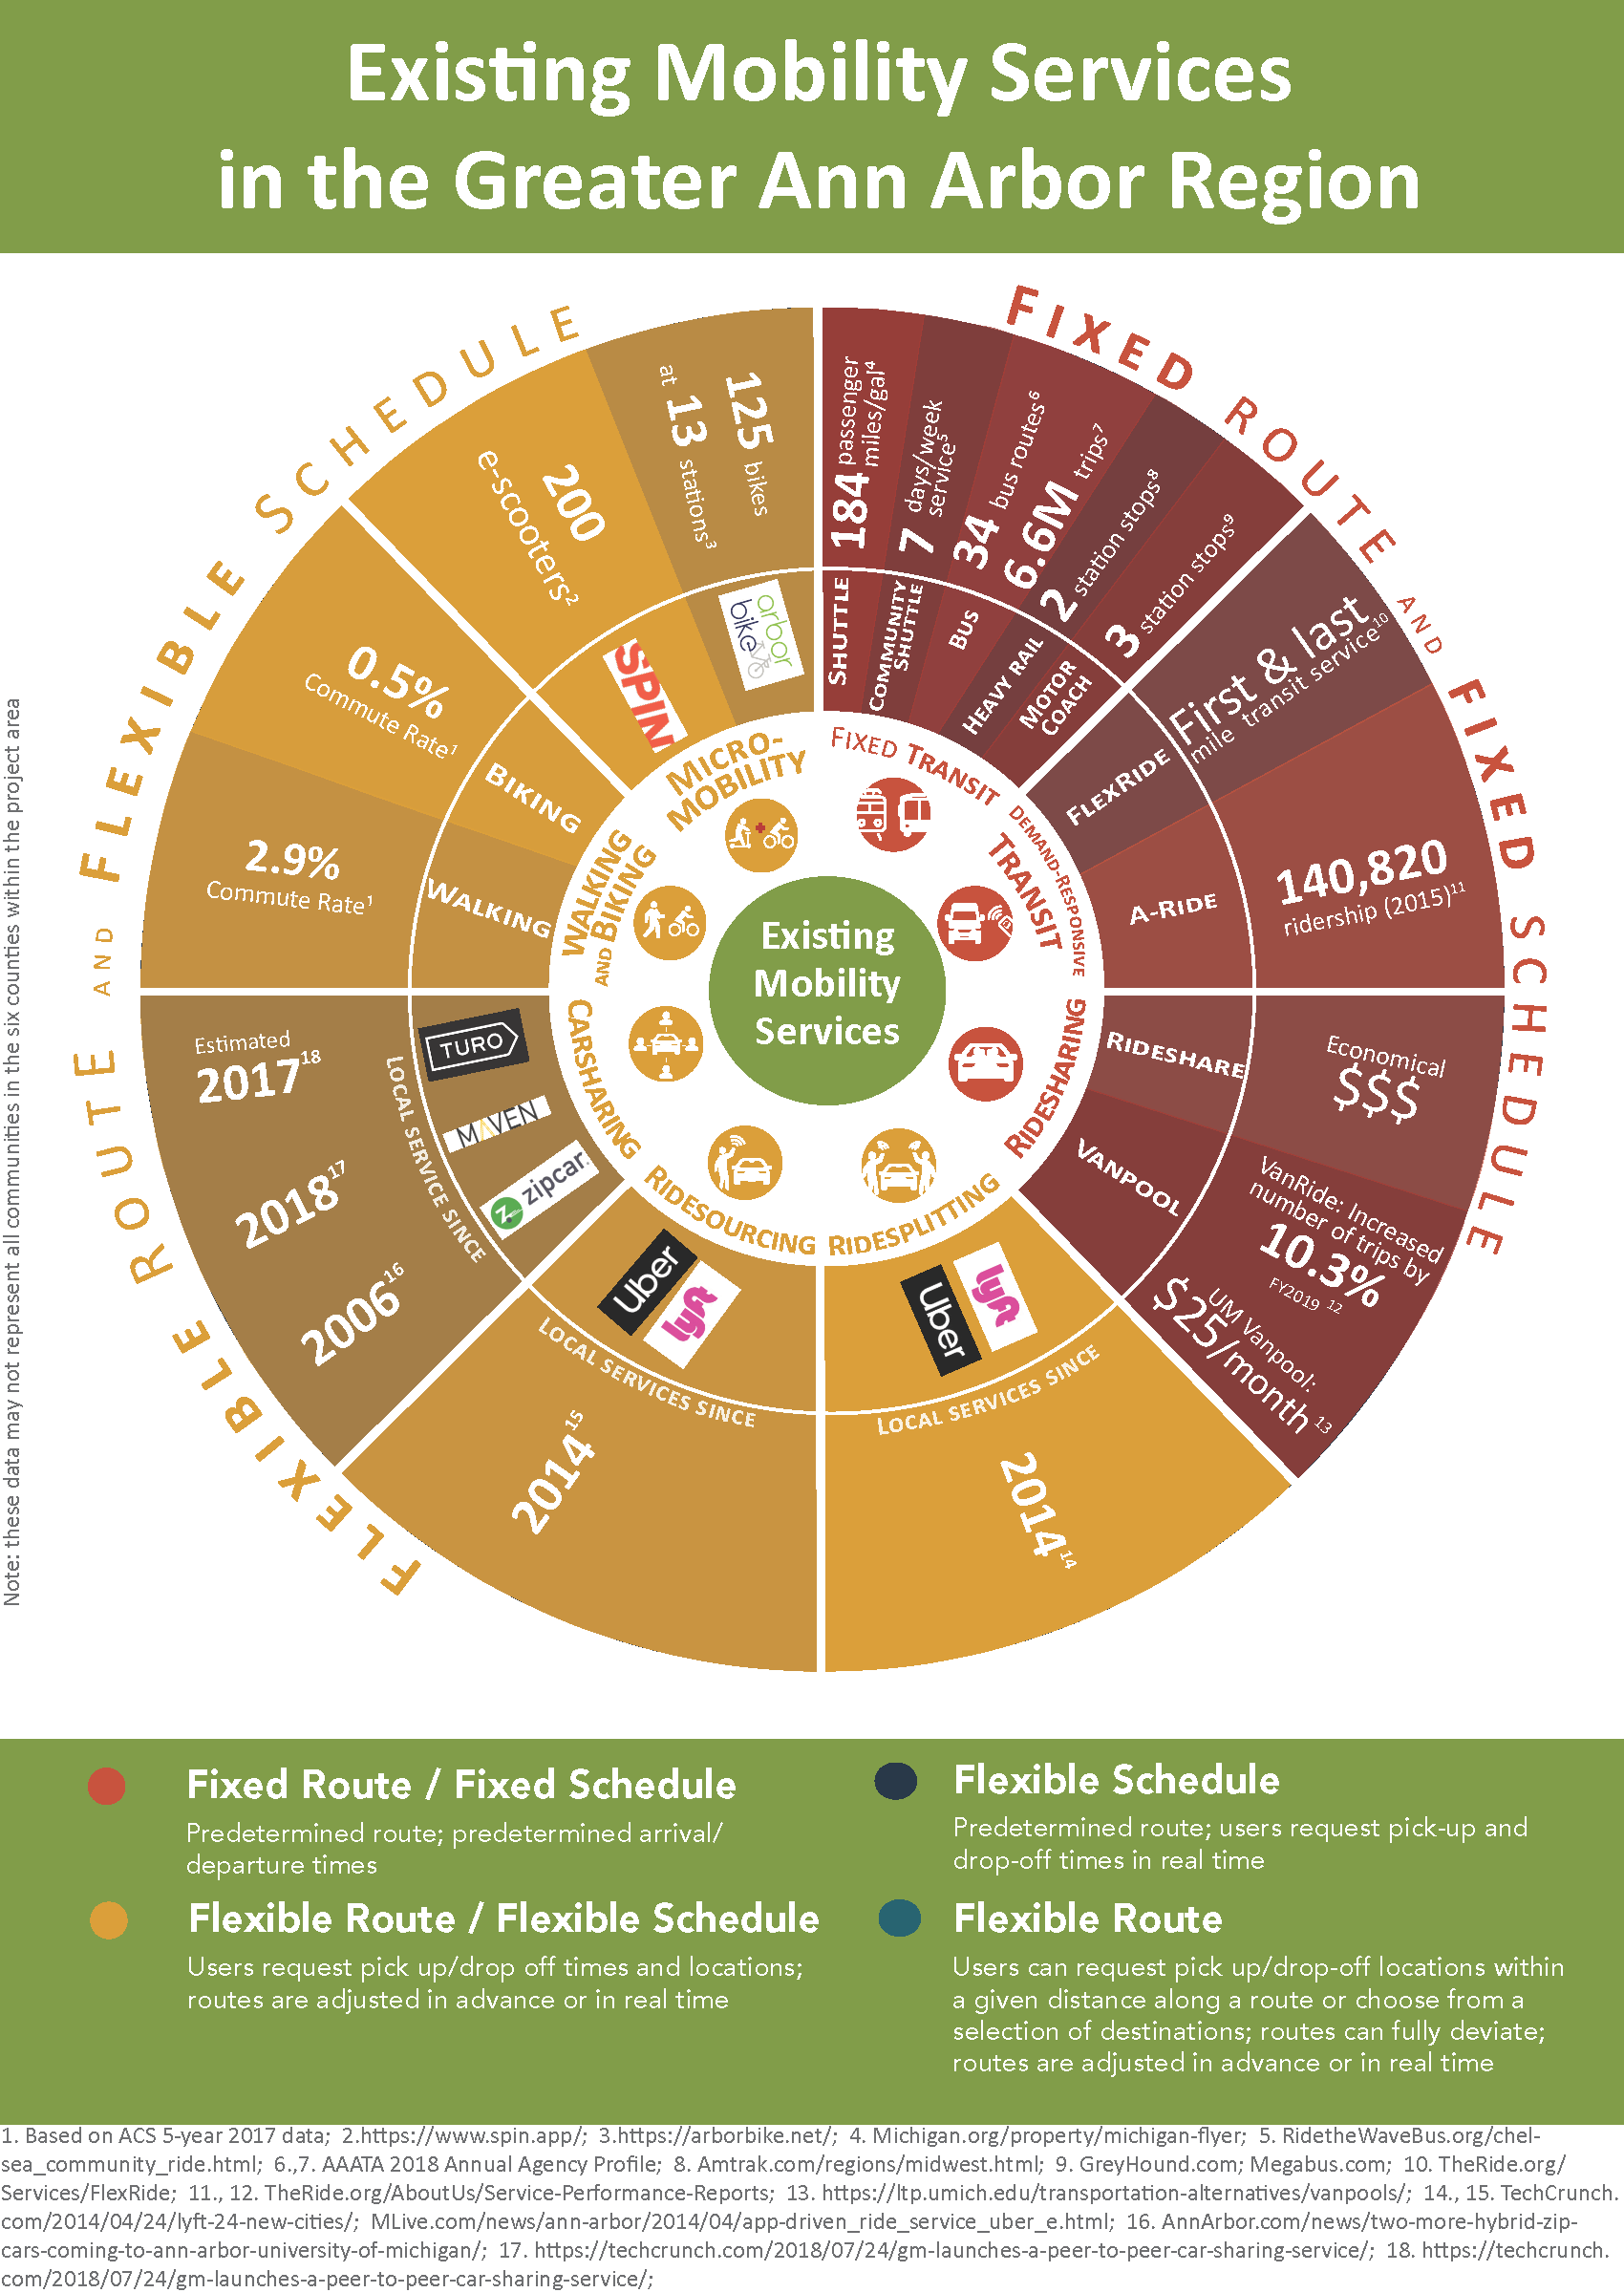
EXISTING SERVICES IN THE REGION
The Greater Ann Arbor Region has a variety of existing mobility services including:
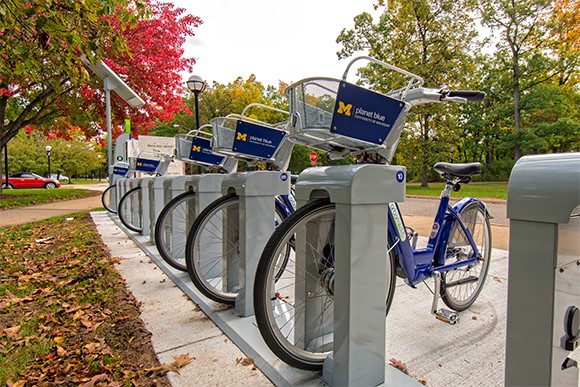
- Fixed transit services are provided by The Ride, Lake Erie Transit, the Jackson Area Transit Authority, and UM Campus Transit. In 2018, The Ride provided 34 bus routes and served more than 6.6 million trips. Changes to fixed route services are continually evaluated. In Livingston County, a fixed route bus service is a recommendation of the Transit Master Plan to connect Fowlerville, Howell, and Brighton.
- The Ride has piloted a number of demand-responsive transit services as part of their FlexRide service and is considering expanding it to more areas. LETS, People’s Express, and WAVE all provide demand-responsive transit services in other parts of the region.
- Uber and Lyft have operated since 2014 but only pick-up in parts of Lenawee, Livingston, and Washtenaw Counties.
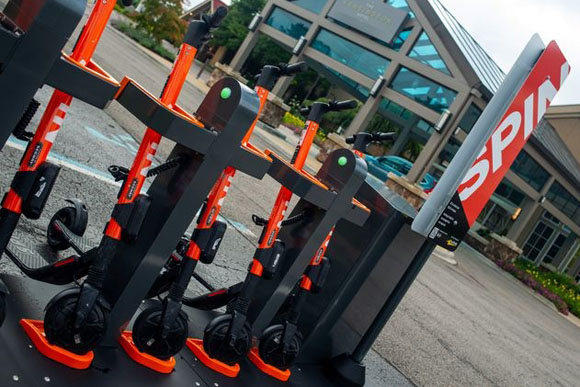
- Spin has an agreement with the City of Ann Arbor and the University of Michigan to operate 200 e-scooters in these areas.
- Michivan is a state-funded vanpool service operated by Enterprise, who supplies and insures the vans.
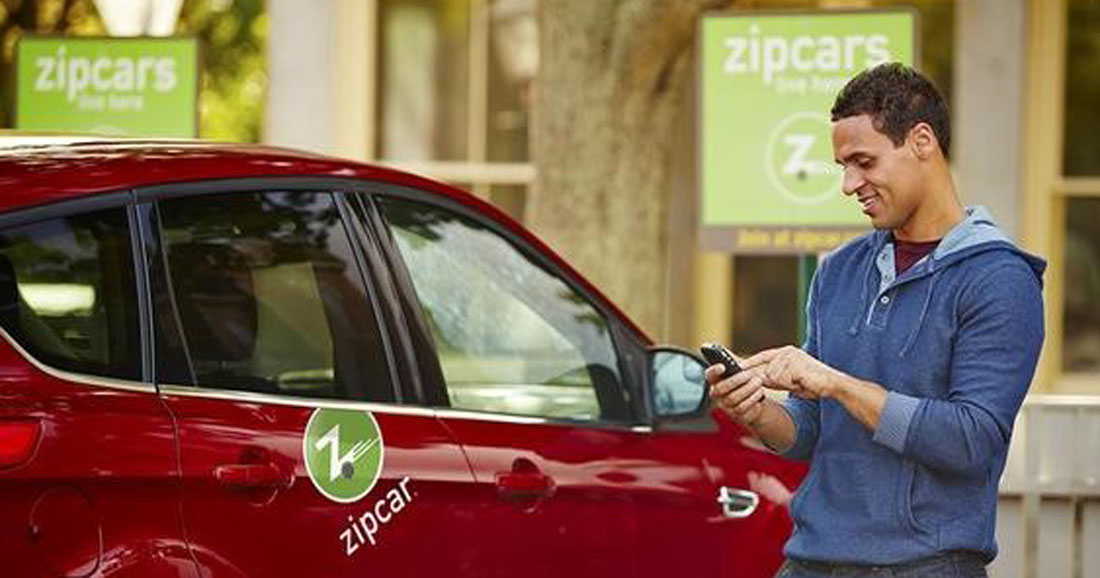
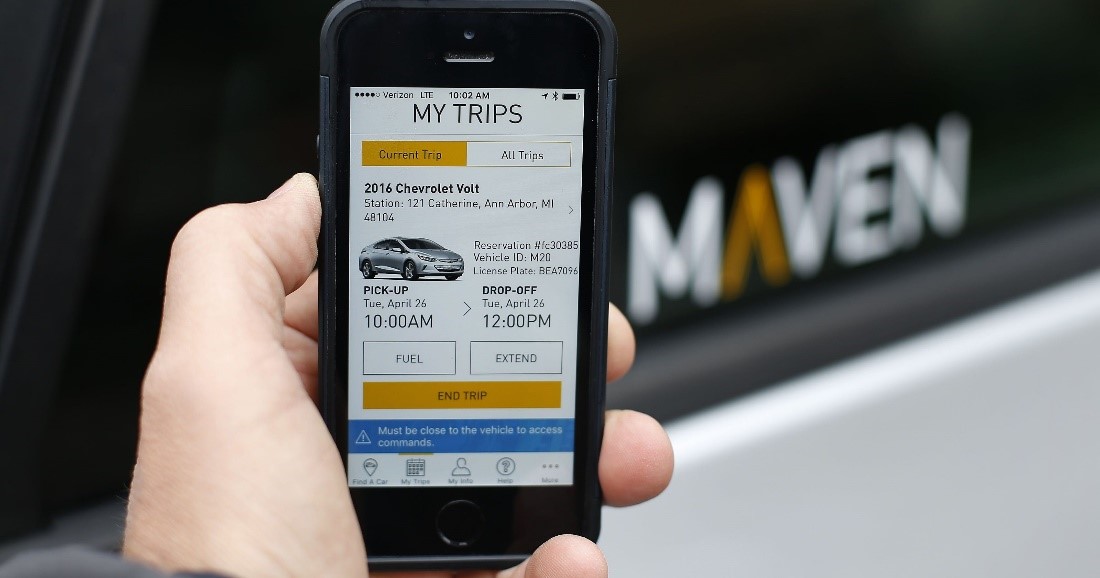
- Zipcar has operated roundtrip carshare in Ann Arbor since 2006. Maven and Turo have provided personal vehicle sharing services for the last 2-3 years.
Click on the infographic to enlarge it and find out more information about existing services in the region.
OPPORTUNITY AREAS
The fixed transit network is the most established and complete non-automobile option to connect residents to jobs in the region and it best serves people that live or work close to it. For those living or working more than a comfortable walk from the network, there are shared mobility services that could make the first- and last-mile connections to the transit system. There are also services that could provide access for residents and employees located in areas with no or less frequent transit service.
A GIS-analysis was used to identify these different opportunity areas. These can then be matched to the appropriate shared mobility services.
TRANSIT NETWORK
The fixed transit network includes services offered by The Ride, Lake Erie Transit, and the Jackson Area Transit Authority. These services were coded into three networks:
- Frequent Transit Network (FTN): transit services providing 15-minute or lower headways during weekday peak hours (i.e., 7-9 AM and 4-6 PM).
- Semi-Frequent Transit Network (SFTN): transit services providing 30-minute or lower headways during weekday peak hours (i.e., 7-9 AM and 4-6 PM).
- Off-Peak Transit Network (OPTN): transit services providing 30-minute or lower headways during off-peak hours (i.e., 5-7 AM, 9 AM – 4 PM; and 6 PM – 12 AM).
ACCESSIBILITY
The analysis includes the following accessibility metrics:
- Residents: the number of people living in the opportunity area
- Equity Residents: a subset of residents that meet the racial and income analysis criteria.
- Jobs: the number of jobs in the opportunity area
- Equity Jobs: a subset of jobs that meet the wage-paying analysis criteria.
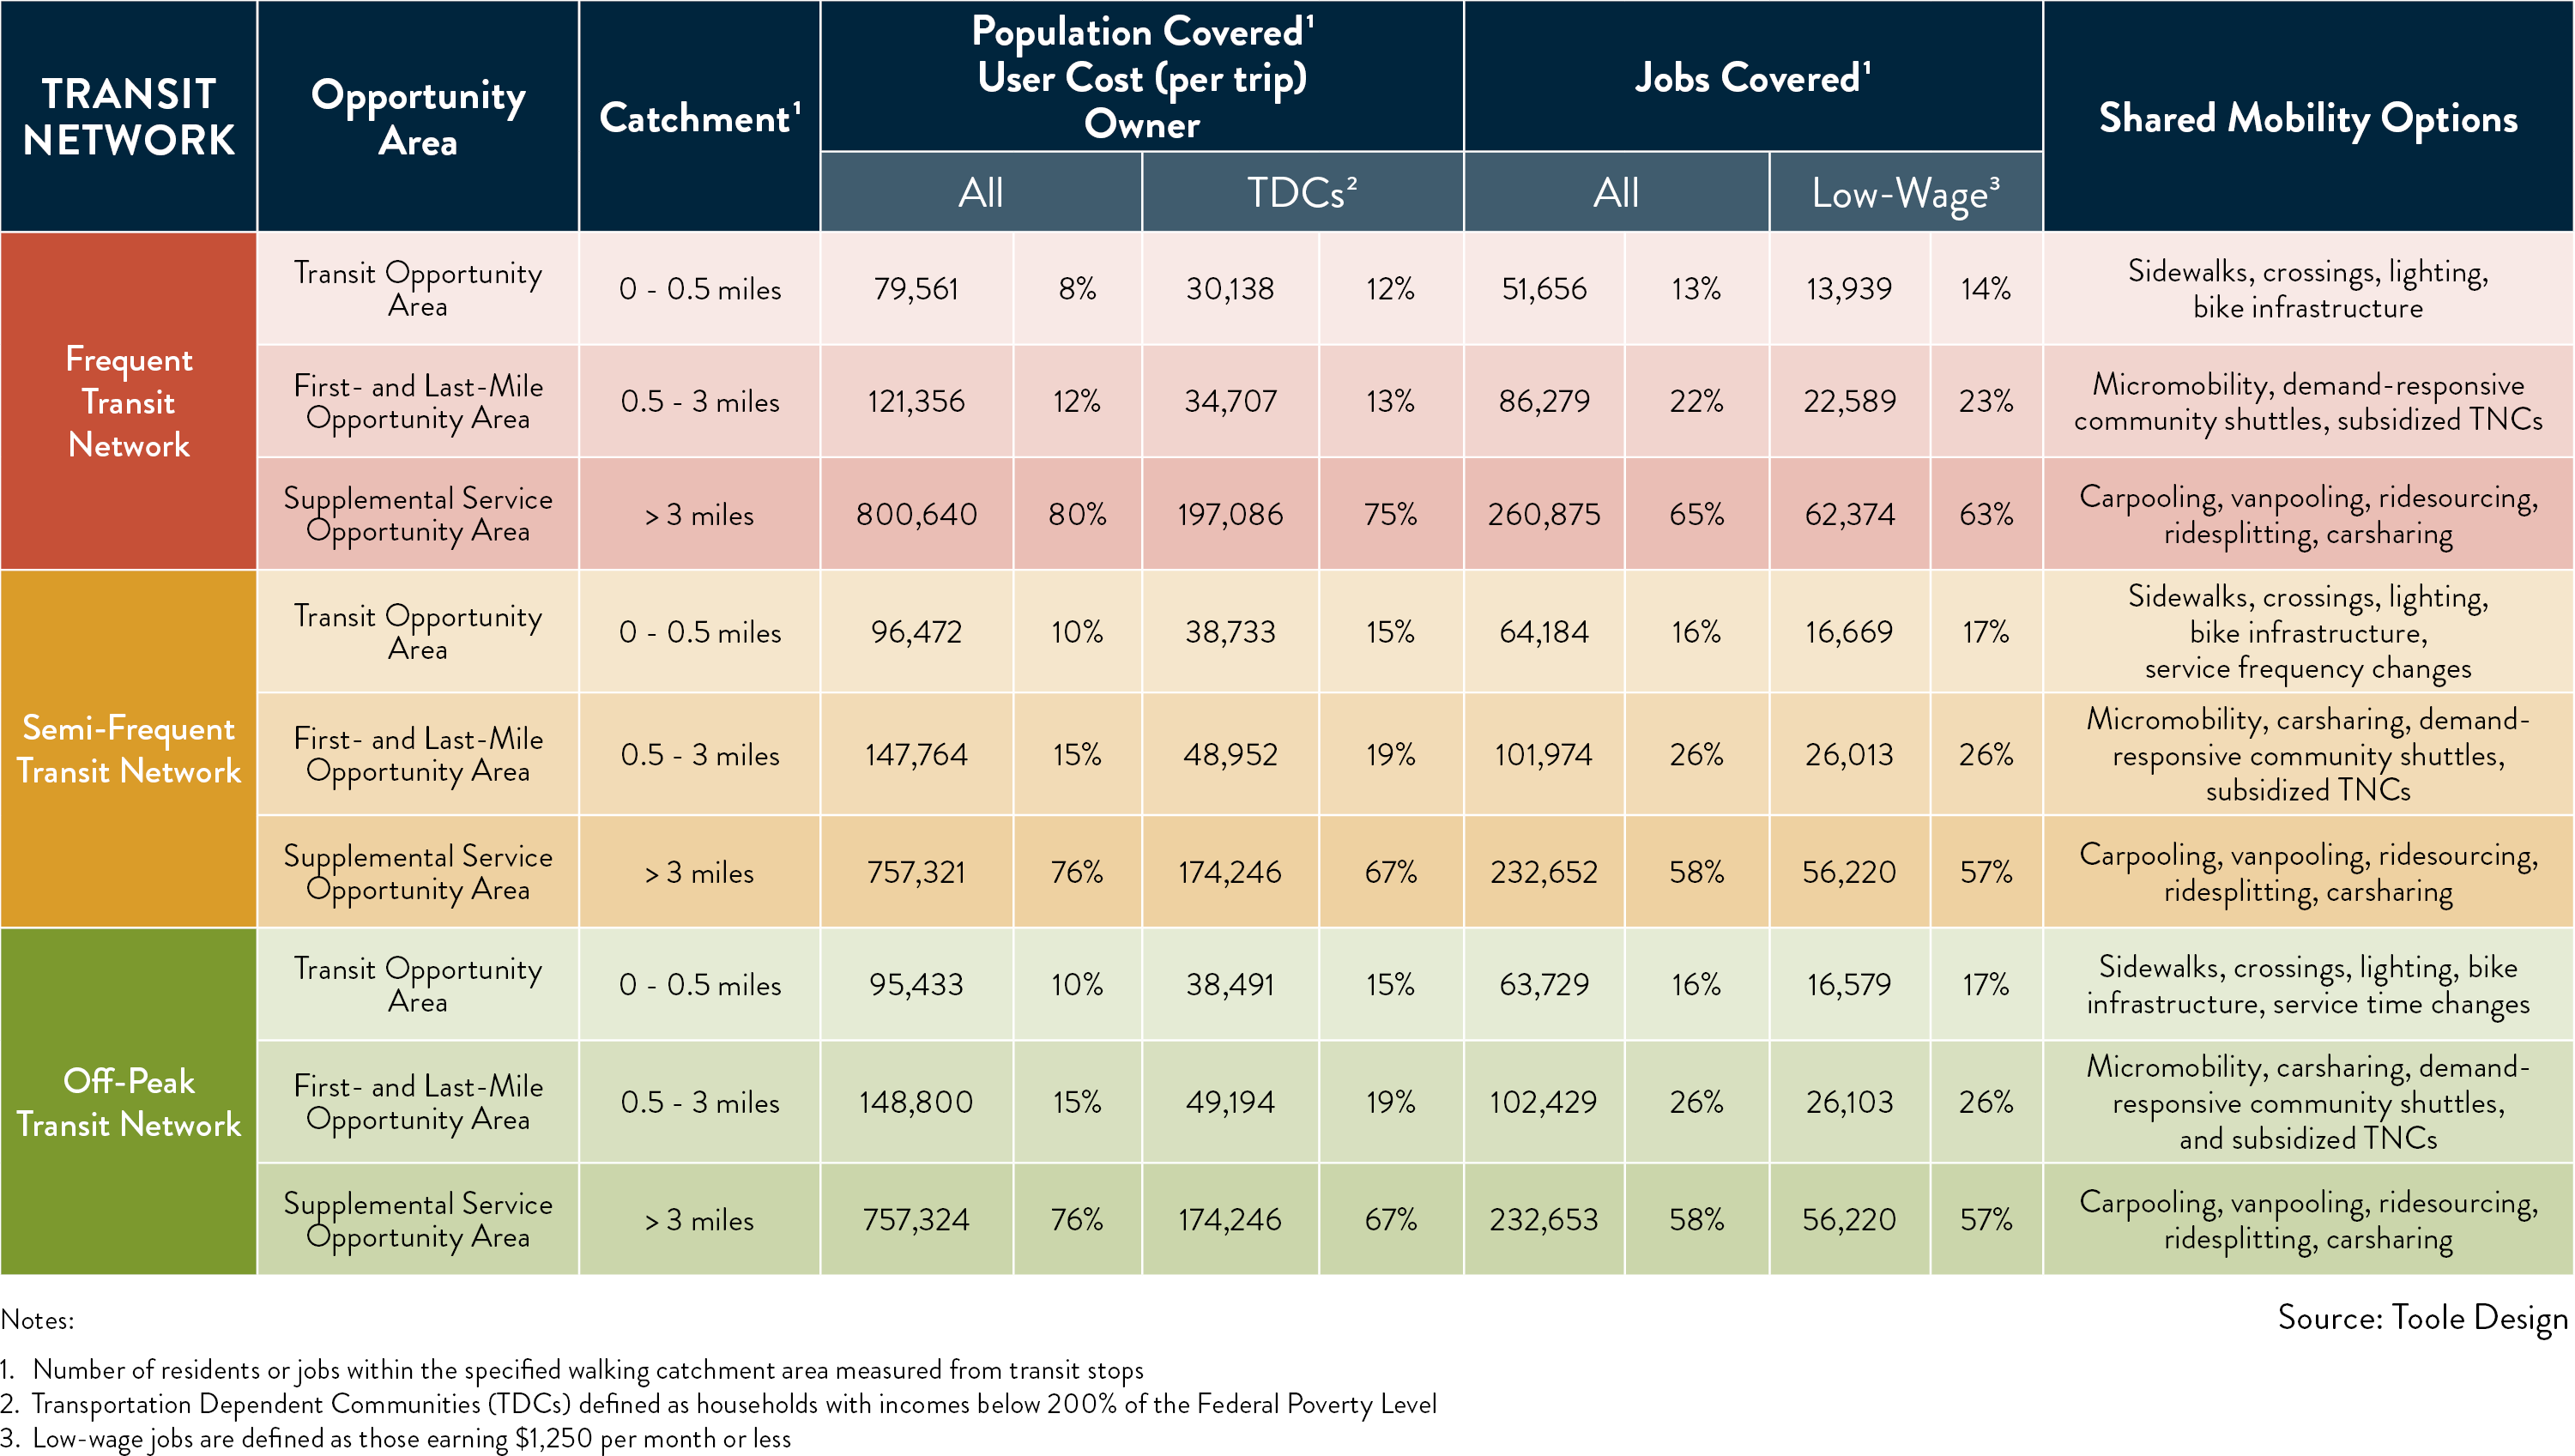
OPPORTUNITY AREAS
The following opportunity areas were defined around the different transit networks:
- Transit Opportunity Area: residents and jobs located within a ½-mile walk of the transit network. Improvements to the fixed transit network will best serve these people.
- First- and Last-Mile Opportunity Area: residents and jobs located between a ½- and 3-mile walk from the transit network. Short-distance shared mobility options such as micromobility, demand-responsive community shuttles, and subsidized TNCs could deliver these people to the fixed transit system for longer-distance travel.
- Supplemental Service Opportunity Area: residents and jobs located more than a 3-mile walk from the transit network. These people, as well as those needing access to jobs during times with no or less frequent transit service may benefit from shared mobility options such as car- and vanpooling, ridesourcing and splitting, and carsharing.
The following table shows the number of residents in each of these opportunity areas and the shared mobility options that could best serve them:
IMPACTS ON TRANSPORTATION DISADVANTAGED COMMUNITIES
Shared mobility programs have the potential to increase mobility options and improve travel efficiency.1 However, these services are often not equally accessible to all populations and if not designed appropriately, can exacerbate existing transportation inequities.
Transportation Disadvantaged Communities that could be at risk of further inequities from shared mobility, include low-income, people of color, youth, elderly, unbanked, digitally disconnected, and individuals with physical mobility limitations. The common barriers to participation for these groups are described below.1 2
One of the largest impacts is felt through increased housing costs that have disproportionately impacted low-income households and people of color and shifted these groups further from the urban core.3 This results in impacted populations living farther away from jobs and services and spending more time and money on transportation to travel longer distances and combine multiple modes of transportation. It is important to recognize the potential role of shared mobility in reducing or exacerbating these inequities. Programs that reduce total travel time, create more seamless transfers, and provide affordable travel options will help to mitigate the cost-burden on marginalized populations.4
AFFORDABILITY AND PAYMENT STRUCTURES
Payment systems and fee structures can be significant barriers to accessing shared mobility services. High per trip costs, large up-front membership fees, credit/debit card payment systems, and a distrust of providing financial information to third parties are all significant barriers.1 2 5 Discounted fare programs, pay-as-you-go, and cash payment options can help mitigate these barriers.
- 7% of the U.S. population is completely disconnected from the mainstream banking system
- 19% rely on financial services outside of the insured banking system.6
TECHNOLOGY USE AND INTERNET ACCESS
Several technology-related issues such as lower rates of access to internet, smartphone ownership, and data plans; as well as lower proficiency or disabilities in the use of technology are also barriers to shared mobility.1 2 7 Programs that provide access to services for users without smartphones (e.g., dial-a-ride), provide public Wi-Fi access, and provide training or educational assistance on how to use the program can increase participation.
- In 2016, approximately 33% of adults did not own a smartphone.8
System Planning, Investment, and implementation
Shared mobility programs are often first deployed in areas with the highest population densities and demand rather than in areas with the highest need. Many of these services are privately funded and as such need to maximize their cost recovery. The public sector can provide incentives or subsidies to provide service in lower-density areas, help to promote and encourage these services, incorporate services into MaaS and other integrated mobility platforms, and set minimum service levels to help mitigate these concerns.
Language barriers, low program awareness, and a lack of suitable accommodations for people with mobility limitations can also prevent certain populations from accessing shared mobility programs. Shared mobility programs that provide multi-lingual apps and service information, conduct targeted outreach, provide user trainings, provide voice-activated app features, and provide adaptive vehicles or alternative accommodations can help address these barriers.1 2 3
CARSHARING
Description: Carsharing is a service that provides members with access to an automobile for short-term use – usually hourly or daily. Types of carsharing include:
- Round-trip: where customers borrow and return vehicles to and from the same location.
- Point-to-point: where customers pick-up a vehicle at one location and drop it off at another.
- Personal vehicle sharing: where private car owners allow their vehicles to be rented through a third-party app. These vehicles are round-trip and returned to the same location.
Operating Model: Private companies own and operate the vehicle fleets used in roundtrip and point-to-point carshare models and provide the locking and access technologies (via an app) in the personal vehicle sharing model with the fleet provided by private individuals.
Active Programs: ZipCar (round-trip); Gig (point-to-point); Maven, Getaround, Turo (personal vehicle sharing).
Closed Programs: A number of programs including ShareNow (a merger of Car2Go and ReachNow) and LimePod, both point-to-point services closed in 2019. Some of the challenges facing the carshare industry include being capital intensive to provide a robust network of vehicles, the cost of maintenance, insurance, and other operations, and competition from other lower-cost mobility services.
Average Trip: 47 miles (round-trip)1, 25 minutes and 2 miles (point-to-point)2, 3.2 days and 104 miles per day (personal vehicle sharing)3.
Pricing Model: Different models exist including an annual or monthly fee plus a per hour fee; a direct per hour or per day fee; or a pay-by-the-minute payment model.
Summary: Round-trip carshare is suited to short trips to access services and run errands or for day-trips where there is a short turnaround at the destination and/or a need to guarantee the vehicle for the return trip. Point-to-point carshare is more suited to short one-way trips such as commuting to work and running errands and can supplement or replace transit. Because there is no guarantee of the vehicle for the return trip, the usefulness of the service depends in part on the size and availability of the fleet.
Equity Considerations: Research has shown that carshare is most frequently used by the populations that represent its service areas, which are disproportionately white, well educated, and higher-income.
Links to more information:
- To learn more about a pilot program in Seattle that used point-to-point carshare as a first and last mile connection to transit, click here.
- To learn more about the challenges for companies operating point-to-point carshare, click here.
- To learn more about a pilot program providing affordable carshare to low-income communities in LA, click here.
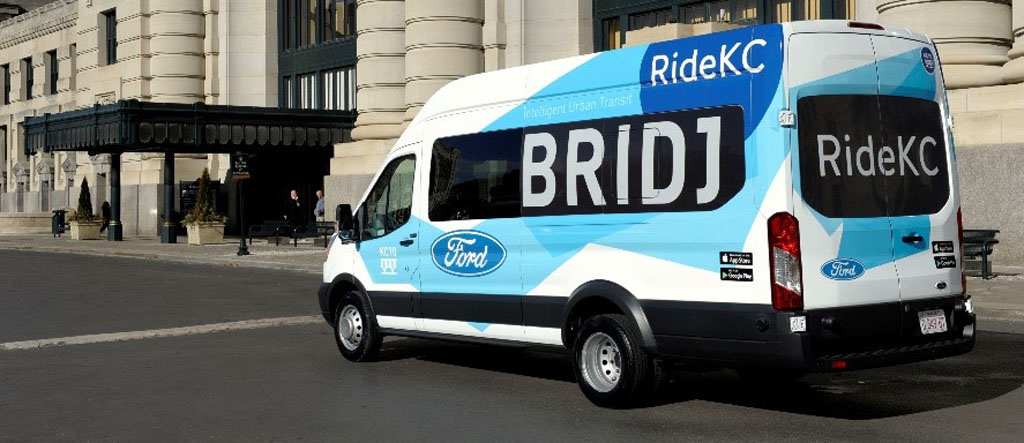
DEMAND-RESPONSIVE TRANSIT
Description: Demand-responsive transit refers to technology-enabled services that offer a flexible route, schedule, or both. Examples include public transit services that allow for advance reservation, door-to-door pick-up and drop-off, or private services like those provided by Bridj or Chariot, which serve passengers in real time using dynamically-generated routes. Since they provide transit-like service but on a smaller, more flexible scale, and often using smaller vehicles, these services are often referred to as “microtransit” or “flex transit”.
Operating Model: Various models exist, either public agencies or private companies own and operate fleets of vans, shuttles, or buses. Passengers request rides using third-party technology, typically a smartphone app or website. Rides are requested either one or two days in advance or in real time, depending on the program and technology used. Types of programs include:
- Flexible schedule: There is a predetermined route – typically with designated stops and users request pick-up and drop-off times in advance or in real time
- Flexible route: Users request pick-up and drop-off locations within a given distance along a route or choose from a selection of destinations; routes are adjusted in advance or in real time
- Flexible route / flexible schedule: Users request pick-up and drop-off times and locations and routes are adjusted in advance or in real time
Active Programs: Flex Ride (serves Pittsfield Township and Southeast Ypsilanti), WAVE (serves Western Washtenaw County), and A-Ride (shared, paratransit service)
Closed Programs: No closed programs were identified in the six-county region. Nationally, several programs in cities and counties have chosen not to renew pilot projects due to high operational costs and low participation rates or ridership.
Average Trip: Up to 10 miles1
Pricing Model: Users pay on a per trip basis, typically at the time of reservation.
Summary: Demand-responsive transit is a relatively new mobility option. Its most effective applications are in areas with lower densities or as a supplement to deliver people to fixed transit services. However, it is important to understand that any transit service provided in low-density areas is likely to have lower ridership and require other funding to be sustainable. Most experts believe that it should not replace fixed transit services where those services are viable. Programs can operate using different formats and varying levels of technology. Demand-responsive transit applications are most popular in urban and suburban communities, but there are some applications in rural areas.
Equity Considerations: Demand-responsive transit programs can be highly-dependent on technology and may create barriers to certain population groups. Service providers should include multiple payment options (e.g., credit card, money order, and cash) and allow users to submit ride requests via multiple media including online, by smartphone app, or by phone. These offerings will help serve populations of concern, such as lower-income, youth, and elderly populations who may not have access to credit cards, bank accounts, smartphones, or data packages large enough to support the use of apps.2
Links to more information:
- For more information about demand-responsive programs that use flexible routes and fixed schedules click here or here.
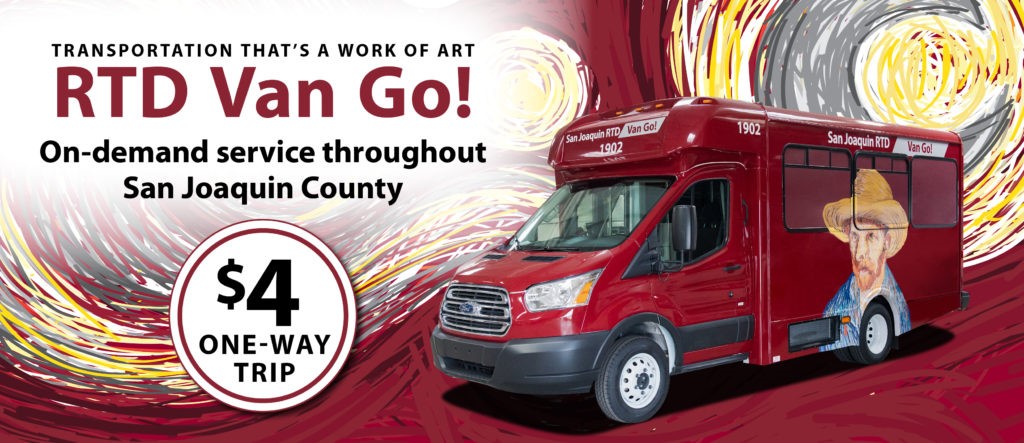
- For more information about demand responsive program in a rural area in California, click here.
- For more information about a demand-responsive workforce program, click here.
- For a report summarizing a variety of demand-responsive transit programs, click here.
- For more information about a demand-responsive community shuttle from in Austin, TX, click here.
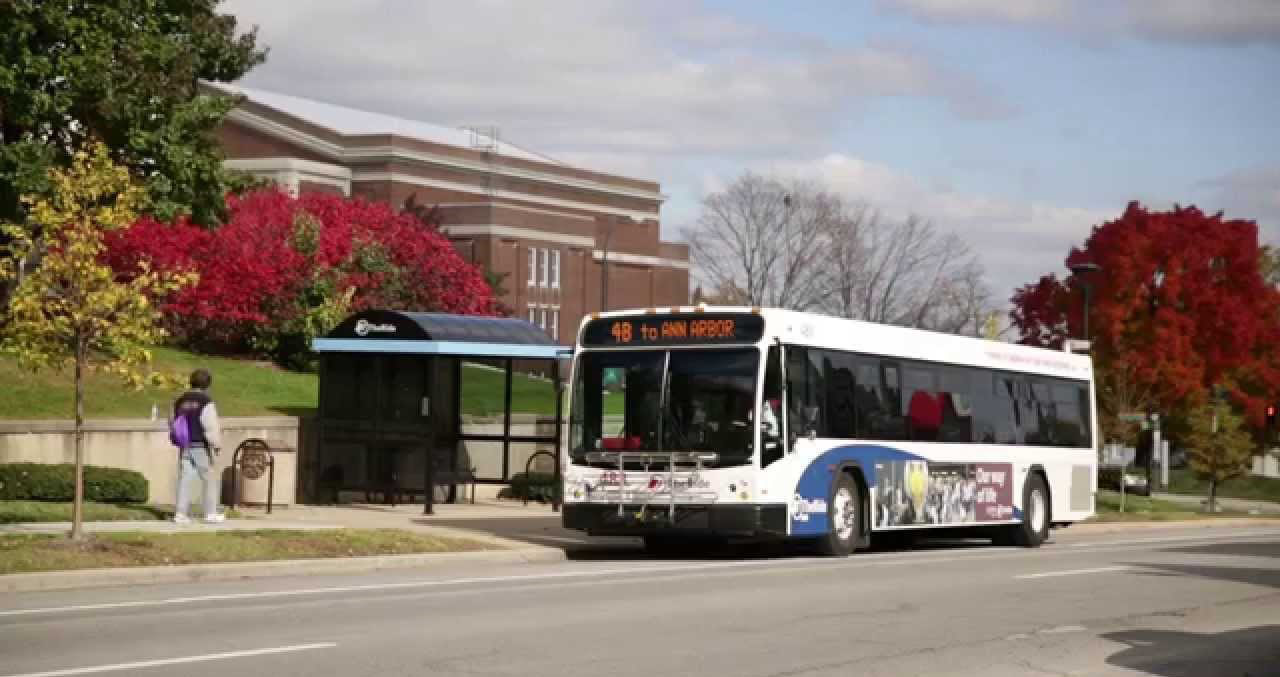
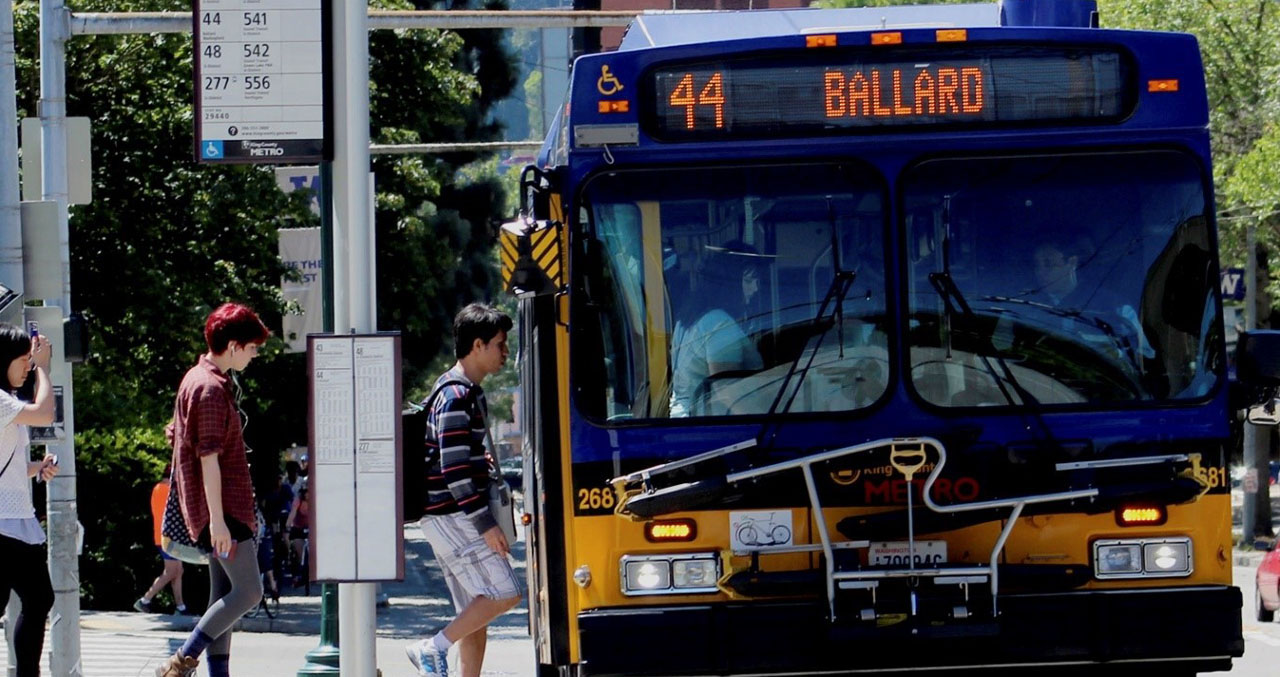
FIXED TRANSIT
Description: Fixed Transit is used here to refer to publicly-owned fleets of buses, trains, ferries, and other vehicles or shuttle services operated by private companies that operate on fixed routes and fixed schedules. Types of fixed transit include:
- Public Transit: Transit systems that are owned and managed by a public agency and are available to all people within a specific service area.
- Private Shuttle Service: Privately-owned systems that serve specific rider groups such as employees, building residents, or regional destinations (e.g., health center).
Operating Model: Public transit is provided by a local or regional transit agency that owns the system and its fleet and manages operations. Operations are provided by the transit agency or contracted to third-party operators. Services are provided at different levels with frequent and high-capacity services provided along the highest demand routes and lower frequency and capacity services provided in lower-demand areas.
In some communities, public- or privately-owned shuttle services provide transportation to and from high-capacity transit routes or to specific destinations, such as health centers, shopping malls, or large employers that are located beyond high-capacity transit routes. Private or employer-provided shuttles are owned and operated by the employer or a third-party.
Active Programs: Fixed transit services in the Greater Ann Arbor Region include:
- Public Transit: Fixed route and scheduled services provided by The Ride, Lake Erie Transit, the Jackson Area Transit Authority, and UM Campus Transit.
- Private Shuttles: Michigan Flyer (shuttle to Detroit Metro Airport), Chelsea Community Ride (free community shuttle).
Closed Programs: It is rare for public transit programs to close. However, transit agencies frequently assess their performance and make service changes that could include altering routes, increasing or decreasing service frequency, or closing routes. Agencies, such as AC Transit in the Bay Area of California, sometimes experiment with demand-responsive transit as an alternative or to supplement fixed route services.
Average Trip: Nationwide, the average public transit trip is 3.8 miles long.1
Pricing Model: There are some transit agencies that operate free shuttles. However, users typically pay per trip and purchase tickets on a per trip, per day, or monthly basis. No account or membership is required to use these services.
Operating Cost: Fixed transit services exist in a variety of land use contexts but are best suited to urban, suburban, and higher density routes where higher ridership can help recoup the cost to operate. The farebox recovery of services in Ann Arbor (i.e., the amount of operating cost recouped by fare-paying riders) was 16 percent for The Ride in 20182. Public funding typically fills in the remainder of the funding gap.
Summary: Fixed transit is one of the least expensive options for a user but may be a less-convenient option due to the time needed to get to a stop, the vehicle stopping to pick-up and drop-off passengers, and the time associated with waiting or needing to transfer between services. Fixed transit services are well suited to medium- (e.g., 3 miles) or long-distance (e.g., 6+ miles) trips. Approximately eight percent of commuters in the Greater Ann Arbor Region use transit as their primary mode of transportation to get to work.
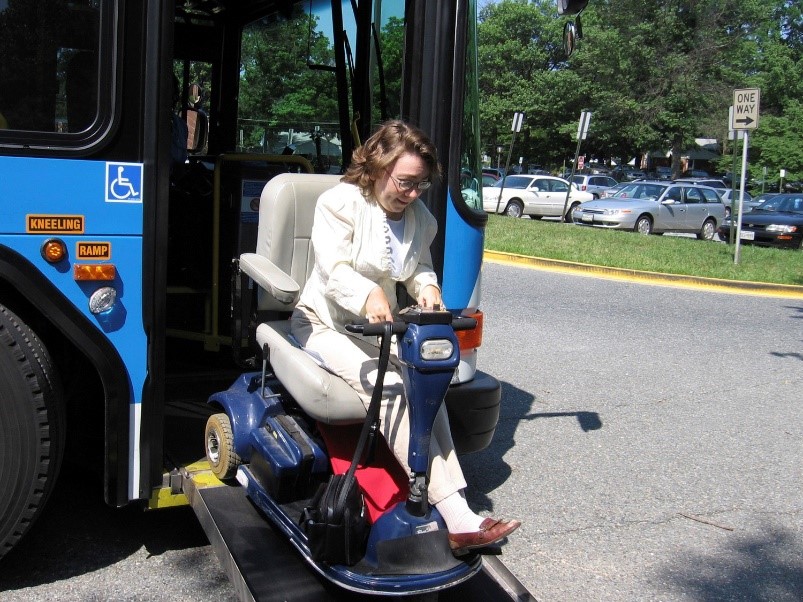
Equity Considerations: Publicly-provided fixed transit provides service to all populations, including people of different ages, races/ethnicities, incomes, and physical abilities. As publicly-funded programs they must meet the requirements of Title VI of the Civil Rights Act of 1964, the Americans with Disabilities Act (ADA), and other federal requirements. Many fixed transit services, including The Ride, offer discounted rates to vulnerable population groups, such as seniors, low-income populations, and students. The Ride offers free transit to people with physical mobility limitations.
Links to more information:
- For more information about public transit services in Michigan, click here.
- For more information about community shuttles in Chelsea, MI, click here.
- For more information about half/reduced fare programs, click here.
- For more information about services provided by The Ride, click here.
MICROMOBILITY
Description: Micromobility is a service that provides users access to bikes, scooters, and other personal transportation devices to make one-way trips in a designated service area. Types of micromobility include:
- Docked: where customers rent a bicycle or e-assist bicycle (e-bike) from one station and return it to any other station in the network.
- Dockless: where customers rent a bicycle, e-assist bicycle, e-scooter, or other personal transportation device and can park it where they end their trip within a defined service area.
Operating Model: Traditional bikeshare models involved government agencies or non-profit organizations owning and funding these programs through a combinations of grants, sponsorship, and user revenues and contracting operations to a private company. More recently, private companies own and operate the vehicle fleets and get access to the public right-of-way through a use agreement or permit system.
Active Programs: ArborBike (docked bicycles); Spin (dockless e-scooters).
Closed Programs: A number of docked bikeshare programs have revamped their operations to move towards becoming dockless. A number of companies have stopped offering dockless bikes to focus on e-scooters. A number of dockless companies have closed or removed their North American operations in the last two years.
Average Trip: 1.2 miles (annual member) and 2.5 miles (casual member) (docked bike), 1.6 miles (dockless e-bike), 1.2 miles (dockless e-scooter)1.
Pricing Model: different models exist. Docked systems typically offer a per year, per month, per trip, or casual membership and a pricing plan based on how long the bicycle is checked out. Dockless systems typically have an access fee and a per minute pricing model.
Summary: Micromobility is a relatively low-cost way to make short trips and are often used to connect to transit, to get to work, social trips, and for recreation or exercise. Docked systems provide organized storage reliability on where users can find a device. Dockless systems provide more flexibility as they can be parked anywhere in the right-of-way.
Equity Considerations: Research has shown that bikeshare is most frequently used by the populations that represent its service areas, which are disproportionately white, well educated, and higher-income. Less is known about the operation of e-scooter users.
Links to more information:
RIDESHARING
Description: Ridesharing involves organizing multiple passengers into a single trip with one of those people acting as the driver. Ridesharing may include door-to-door service or designated pick-up or collection points. Types of ridesharing include:
- Informal carpooling: People that know each other or find each other on an online ride board or rideshare site (e.g., craigslist) organize themselves to share rides
- App-based carpooling: The person driving uses an app-based matching service such as Waze Carpool or Blablacar to find passengers
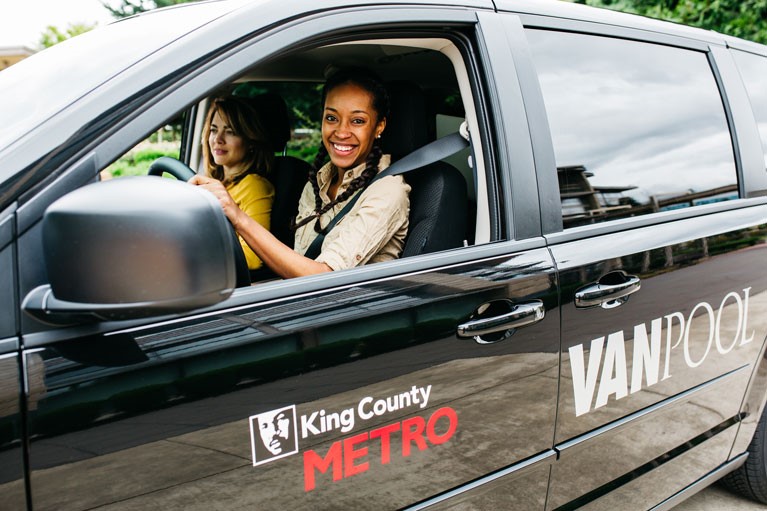
- Vanpooling: Typically an employer- or agency-provided fleet vehicle and an internal matching or sign-up program
- Matched rental car services: A rental company, such as Enterprise Commute provides the vehicles and the matching service
Operating Model: Passengers and drivers sign up to participate in ridesharing programs either informally, or formally through an employer, government agency, or app-based matching service. Many formal vanpool programs provide emergency rides home for users under specific circumstances. For most formal vanpool or matched rental car programs, the sponsoring agency covers the cost of providing, maintaining, insuring, and licensing the vehicles.
Active Programs: UM Carpool (University of Michigan carpool program), Commuter Connect (commuter matching service provided by the Southeast Michigan Council of Governments), MichiVan (a vanshare partnership between MDOT and Enterprise), and UM Vanpool (University of Michigan vanshare program for staff and faculty)
Closed Programs: No closed programs were identified in the six-county region. Nationally, ridesharing services have been around for decades with locally based programs coming and going over time.
Average Trip: Average trip distances vary but cost benefits are most realized over longer distances.
Pricing Model: Costs vary; for informal programs, users typically share fuel costs for each trip. Apps like Waze Carpool provide an estimated cost for ridesharers but allow drivers to set their own costs below a certain threshold. Formal vanpool programs may charge passengers a weekly or monthly fee, but sponsoring agencies provide the vehicle and typically pay the cost of fuel, maintenance, and insurance.
Summary: Ridesharing programs exist in many forms and can be organized by individuals, employers, or third-party smartphone applications or websites that connect individuals with similar trip patterns. Ridesharing can reduce the cost of a trip compared to single-occupancy travel.
Rideshare programs can be successful in all land use contexts and there are several services in Michigan designed to support these efforts, such as MichiVan and Enterprise Commute. Non-profit ridesharing programs also exist and may be more applicable in rural or regional areas. Green Raiteros, an electric vehicle ridesharing program operating in the Central Valley of California, is an example of a grant-funded program operated by a non-profit to provide ridesharing services to low-income farm workers living in rural communities.
Equity Considerations: Similar to other shared mobility services, rideshare programs that are highly-dependent on technology may create barriers to lower-income, youth, or elderly populations, and other populations of concern who may not have access to credit cards, bank accounts, smartphones, or data packages large enough to support the use of apps. Many rideshare programs are informal or have in-person or manual sign-up processes that can address these equity considerations.
Links to more information:
- For more information about MichiVan, click here.
- For more information about the rideshare program offered through Enterprise Commute, click here.
- For more information about Green Raiteros Electric Vehicle Ridesharing Program in Huron, CA, click here.
- For more information about a vanpool program offered by a transit agency in Vancouver, WA, click here.
RIDESOURCING
Description: Ridesourcing is a service that uses smartphone apps or call-in phone services to connect passengers with individual drivers who use their own vehicle or a fleet vehicle to complete user-requested one-way trips. Passengers request a ride in real-time and typically receive door-to-door service. This includes services provided by Transportation Network Companies (e.g., Uber and Lyft), and taxis.
Operating Model: Individual drivers operate their own vehicles to provide on-demand ride services to passengers. Passengers request a driver by calling (e.g., taxi), or using a smartphone app (e.g., TNCs) in real time. Passengers receive door-to-door service.
Active Programs: Lyft, Uber, and various taxi companies operate in the Greater Ann Arbor Region.
Average Trip: Average trip distance varies by geography; the average trip in an urban area is 5 to 6 miles, whereas an average trip in a suburban or rural area is closer to 9 miles.1
Pricing Model: Passengers using TNC or taxi services are required to pay upon trip completion, however, TNCs automatically charge a passenger’s credit card and passengers must create an account to use the service. TNCs typically apply surge pricing which makes trips more expensive during times with high demand. TNC services structure their fees based on the following charges: trip initiation, service attendance, trip distance, and trip travel time. If a user decides to cancel their trip after booking it, there is a cancellation fee. Drivers keep a portion of the fare with the majority going to the TNC.
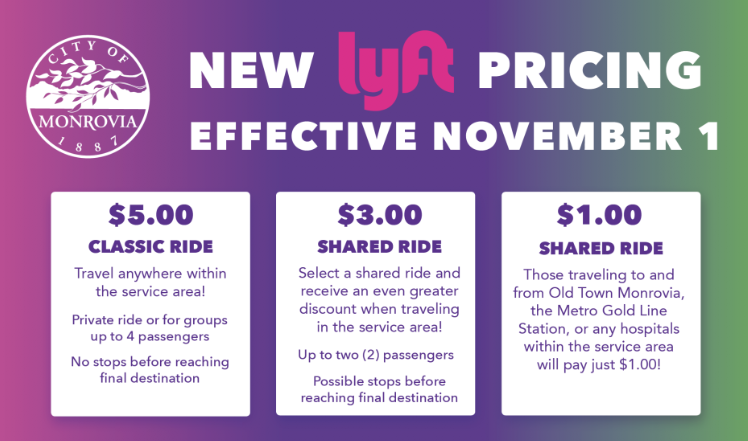
Subsidized Transit: Some communities have piloted subsidizing TNC trips to provide small-community transit, to replace door-to-door or paratransit services, or to provide a similar service to demand-responsive transit and deliver customers to regional fixed transit services. The pilots conducted to date have been partnerships between transit agencies and TNC or taxi companies that limit the service area and cap maximum fares. The passenger pays a flat rate typically ranging from $1 to $5 and the sponsoring agency covers the remainder – typically $5 to $7. This reduces the cost to a user (compared to using a TNC for the entire trip) and can be cheaper than providing a traditional public transit service.2
Summary: Ridesourcing is suited to medium length, one-way trips in urban and suburban areas. This service is typically the most convenient of all mobility options providing on-demand, door-to-door service, but is also the most expensive for passengers. In the Ann Arbor region, TNCs can drop off riders wherever they need to go but will only pick up riders within a certain service area; this limits access for residents living in smaller towns and rural areas of the region.
Equity Considerations: In general, ridesourcing services have been found to be less accessible for people who are older, less technology proficient, require mobility devices, or are low income.3 This is primarily due to the service’s reliance on smartphone technology and high trip costs. Studies on access to TNC services for different racial/ethnic groups are mixed, with some studies showing no difference and access and others identifying significant discrimination against People of Color.4 5 6 Most taxi services provide wheel-chair compatible vehicles and can be accessed via phone calls rather than requiring internet access or use of a smartphone. TNCs that use a privately-owned vehicle fleet may not have wheel-chair compatible options.
Some TNCs are modifying their services to give drivers more ability to choose which passengers they pick up. This may result in reduced services in rural areas which have longer trip distances and lower demand compared to urban areas and results in trips that are less cost efficient for TNC drivers. Providing drivers with more information about passenger and trip information could also exacerbate issues associated driver biases and decrease access to ridesourcing services.
Links to more information:
- For more information about a subsidized TNC program called Go Monrovia, click here.
- For more information about a subsidized TNC program in Arlington, TX, click here.
- For more information about a subsidized TNC program combined with demand-responsive transit, click here.
- For more information about a subsidized TNC program in Ontario, CA, Subsidized TNC program in Ontario, click here.
- For more information about a subsidized TNC study in Ann Arbor, MI, click here.
RURAL TRANSPORTATION SOLUTIONS
Long distances and low population densities result in fewer public transportation options in many rural areas. However, rural areas have a higher proportion of older, disabled, veteran, and low-income populations that require access to jobs, medical, and other services.
There are approximately 1,500 rural transit systems operating in the United States – 69% of these are operated by a government agency and 31% are operated by non-profit organizations.1 A 2015 APTA study found that per capita rural transit ridership increased by 8.6% per year from 2007 to 2015 compared to 2.3% in urban areas.2
Rural transit services are generally more costly to provide on a per capita and per trip basis, although they have a positive benefit-cost ratio when wider community benefits are considered.3 Rural transportation services include:
- Fixed-Route and On-Demand Transit
- Connector Services
- Integrated Regional Transit Services
- Vanpool
- Volunteer Driver Models
- Subsidized Taxi / TNC
- Community TNCs
For more information on planning transportation services in rural communities and small towns, click here and here.
For more information on federal grants and technical assistance for rural transportation, click here and here.
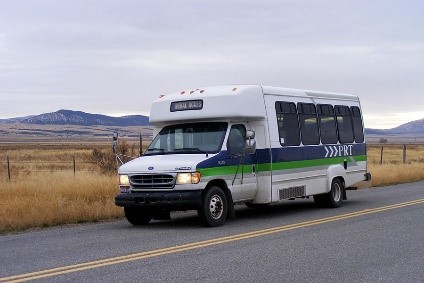
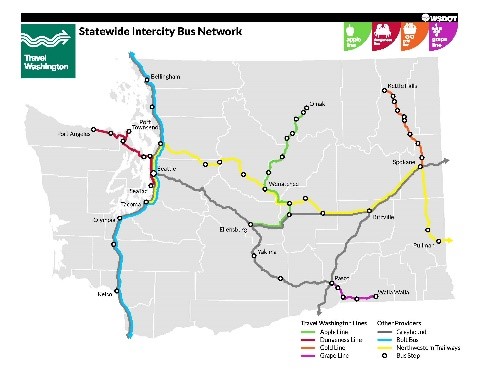
Integrated Regional Transit Services
Local and regional agencies coordinate public transit services to connect communities.
To learn more about how Washington State’s Intercity Bus Network connected local transit networks with private bus operators to provide state-wide regional bus coverage, click here.
Volunteer Driver Models
These programs provide transportation services to passengers by engaging volunteers to serve as drivers. Some models reimburse drivers for their time or mileage, some allow time to be banked for future use, and others use non-reimbursed volunteer drivers.
To learn more about Freedom Road Transportation, which offers volunteer driver transportation services in SE Michigan, click here, here, or here.
Community TNCs
To learn more about ITNCountry, a do-it-yourself TNC that provides the tools for small and rural communities to establish their own mobility service, click here: here.
Mobility as a Service (MaaS)
To view a video describing how Feonix Mobility is providing trip planning and fare payment technologies that combine transit and their own volunteer drivers to solve workforce and other critical transportation needs in Winnebago County, WI, click here and here.
To follow the story of Liberty Mobility Now in Athens, Ohio, from its beginning to its end, follow these links here and here.
CONNECTED & AUTOMATED VEHICLES (CAVS)
In their simplest form, Connected & Automated Vehicles (CAVs) are vehicles that partially or fully remove human responsibility for the driving task. However, these systems are complex and include several levels that vary the interaction of technologies related to the vehicle, the automation of the driving task, and the connection to the transportation system.
Technologies: There are a number of technologies being developed to improve the transportation experience. These include:
- Automating vehicle systems to take over driving tasks
- Adapting the wider transportation system to deliver information and allow connection
- Connecting vehicle systems to the environment
The inter-relationship of these technologies is shown below.

Levels of Automation: The Society of Automotive Engineers (SAE) defines 6 levels of driving automation ranging from Level 0 (fully manual) to Level 5 (fully autonomous).
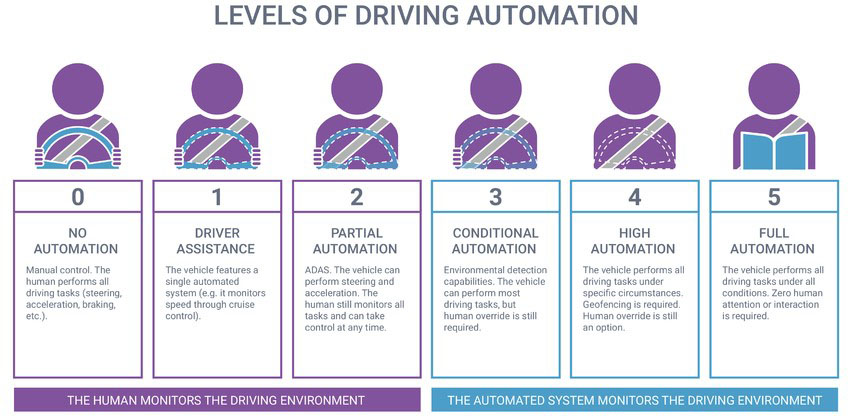
Timeline: Most new vehicles include features from Levels 1 and 2 and vehicle manufacturers are actively developing or testing Level 3 and 4 automation. Levels 3 and 4 are what most of the industry refers to as a “self-driving” car. However, these vehicles still require a driver and therefore do not provide the mass-benefits that may come with full automation. Level 5 – fully-developed, driverless automation is not expected until into the 2030 decade and must address technical and legislative challenges.
Potential Impacts: Research is ongoing into the potential impacts of CAVs, however there could be numerous and wide-spread impacts on travel and land use patterns, traffic and parking demand, safety performance, automobile ownership, public transit services, altered transportation revenues, and increased mobility for non-drivers.
Many auto manufacturers have indicated a desire to introduce CAV technologies as part of ride-sourcing services, e.g., Cruise. There are also several autonomous shuttles in operation using Level 3 and 4 technologies.
Costs: The cost of automated vehicles is expected to be higher than that of traditional vehicles because of the cost of purchasing and servicing the additional technological features that will be needed.
However, introducing economies of scale through the shared economy and removing the cost of the driver could see the cost of ridesharing and ridesourcing services reduce significantly. Potential user cost comparisons2:
- Private automobile: $0.40 - $0.60 per mile $0.60 - $1.00
- Taxi / TNC: $1.50 - $2.50 per mile $0.35 - $0.85
- Public transit: $0.20 - $0.40 per mile $0.20 - $0.40
Limitations and Barriers: There are several limitations and barriers that could impede the adoption of CAVs, including: the development and refinement of the technology, increased vehicle cost and consumer demand, assurance of data security, concern around and proof of conflict-avoidance, regulations compatible with driverless operation, liability laws, and societal attitude and behavior change regarding distrust of automated technologies.3
Links to more information:
- Public Sector Consultants Report: Planning for Connected and Automated Vehicles, click here.
- Autonomous shuttle experience so far: click here.
- Lessons learned and deployment tips from the Mcity Driverless Shuttle pilot on the UM – Ann Arbor campus: click here.